I was wondering if there was a way or some sort of function to pull the summary values of grouped items and find the average?
For example:
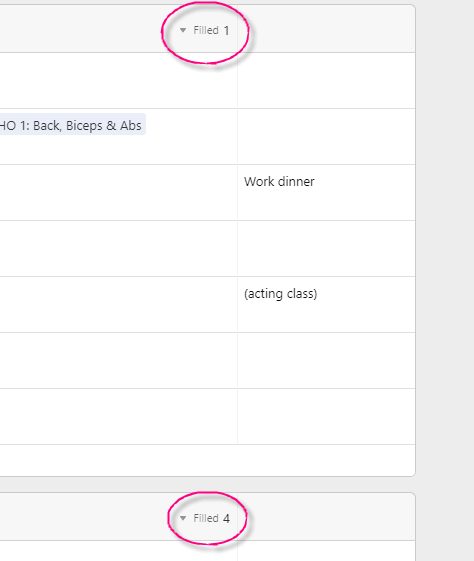
I have 10 groups of data separated out, each representing a Week and within that, I have a record for each day. One of the fields I fill is what workout I did that day. Then I have a summary value for that column display the number of filled cells in that column (so how many times I worked out that week essentially). Is there some way to pull that summary value for each of the groups (the 10 different groups) and have the average of that display? That way I could see the average number of times I work out a week over that 10-week span. Does that make sense?
Here’s what I’m referring to as “summary values” (circled in pink, displayed at the top of each group):

