

Hello! I am using Airtable for our workflow and project forecasting. We have a view that calculates the time in which it took to complete all jobs in the last 45 days, grouped by the separate categories each of those jobs fell under (see image below). I want to use the Avg. amount of time (calculated in weeks) as a figure in a formula to create the installation date of a job in that same category sold today. Is there a way to do this?
I have attempted the separate table, rollup field solution, however, the problem is is that the data being calculated by this view is dynamic. Jobs are added (as they are completed) throughout the day and some jobs that age out of the 45 day range that this table is calculating fall off. The rollup field (in my experience) only grabs the jobs that are done at the time of creation of the rollup field.
Anybody else been able to do this?
Thank you in advance!
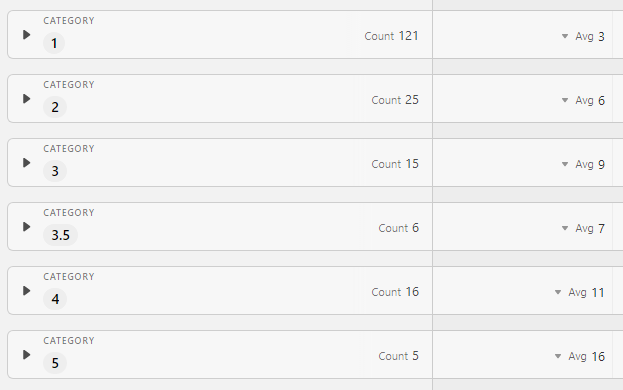
Count is number of jobs completed in that category.