Hi @Matt_Caruso - You could use a Google Scripts automation to pull the data into Google Sheets. Like this:
(I’m guessing at your base structure, but the method outlined here can be modified to suit what you have).
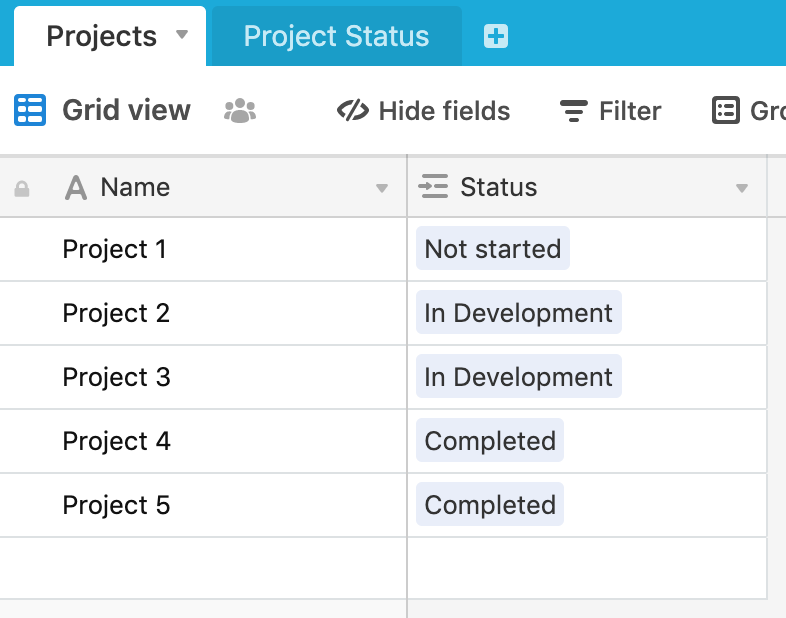
I have a Projects table and each project has a status/phase:

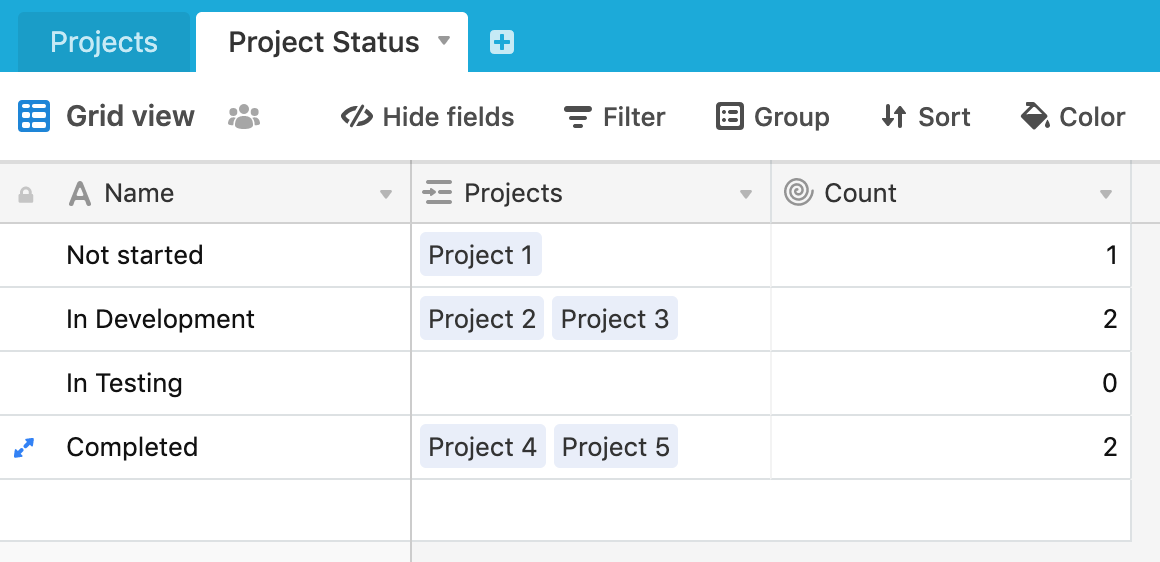
I also have a Project Status table which provides the status as a linked field in Projects and a roll-up field to count the number of projects at a given status:

Then create a Google Sheet and associated Google App script to pull the data from the Project Status table. This is the script:
function getData() {


  var url = "**YOUR API URL HERE**";


  var headers = {"Authorization": "Bearer **YOUR API KEY HERE**"}


  var options =


        {


          "headers": headers,


        };


  var result = JSON.parse(UrlFetchApp.fetch(url, options).getContentText());


  var dataArray = result.records;


  dataArray.forEach(function(element) {


    var name = element.fields.Name;


    var count = element.fields.Count;


    var date = Utilities.formatDate(new Date(), "GMT+1", "dd/MM/yyyy");


    var ss = SpreadsheetApp.getActiveSpreadsheet();


    var sheet = ss.getSheets()(0];


    sheet.appendRow(wname,count,date]);


  });


}
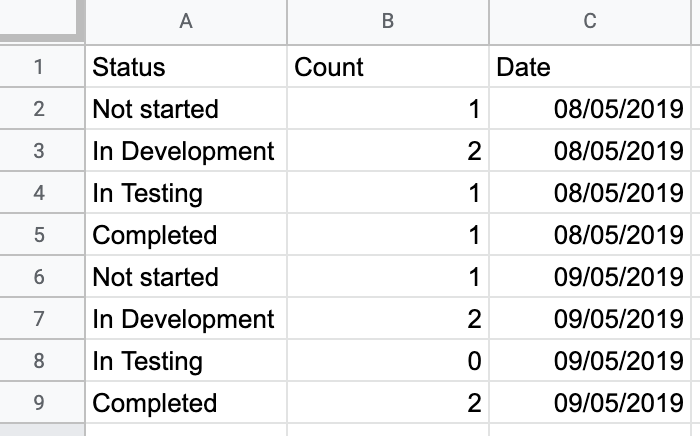
You can then set up a trigger on the project to run the script on a daily basis. This will give you something like this as the result:

Hope this helps
JB
Hi @Matt_Caruso - You could use a Google Scripts automation to pull the data into Google Sheets. Like this:
(I’m guessing at your base structure, but the method outlined here can be modified to suit what you have).
I have a Projects table and each project has a status/phase:

I also have a Project Status table which provides the status as a linked field in Projects and a roll-up field to count the number of projects at a given status:

Then create a Google Sheet and associated Google App script to pull the data from the Project Status table. This is the script:
function getData() {


  var url = "**YOUR API URL HERE**";


  var headers = {"Authorization": "Bearer **YOUR API KEY HERE**"}


  var options =


        {


          "headers": headers,


        };


  var result = JSON.parse(UrlFetchApp.fetch(url, options).getContentText());


  var dataArray = result.records;


  dataArray.forEach(function(element) {


    var name = element.fields.Name;


    var count = element.fields.Count;


    var date = Utilities.formatDate(new Date(), "GMT+1", "dd/MM/yyyy");


    var ss = SpreadsheetApp.getActiveSpreadsheet();


    var sheet = ss.getSheets()(0];


    sheet.appendRow(wname,count,date]);


  });


}
You can then set up a trigger on the project to run the script on a daily basis. This will give you something like this as the result:

Hope this helps
JB
Hi @JonathanBowen! This solution seems really attractive. I love the idea of using the Google script to pull data directly from Airtable without a third party service powering it.
Would it be possible to have the script do the counting? We have a single-select field in our primary table which determines phase, not a secondary table.
Could you point me in the direction of how I’d do the below?
You can then set up a trigger on the project to run the script on a daily basis.
Hi @Matt_Caruso,
Another, slightly easier (ie not requiring code/sheets), approach to this would be to use Zapier’s Schedule trigger. You would pull each record in the ‘status’ table (assuming a setup as Jonathan has outlined above), and write multiple records (n=number of statuses) to a new table for ‘daily status updates’.
For each status, you’d:
- Find the record for that status (more on that here)
- Write a new record in the ‘daily status updates table’ by copying the rollup value to a numeric field (akin to taking a snapshot of the rollup value at a given point in time)
- Move on to the next status. In practice, the number of steps your zap would have would be 1 + 2 * number of statuses. Each status would require a search step and a corresponding step to write a new status update (‘create record’ action).
Hope that helps—let us know which route you end up going!
Cameron
Hi @JonathanBowen! This solution seems really attractive. I love the idea of using the Google script to pull data directly from Airtable without a third party service powering it.
Would it be possible to have the script do the counting? We have a single-select field in our primary table which determines phase, not a secondary table.
Could you point me in the direction of how I’d do the below?
You can then set up a trigger on the project to run the script on a daily basis.
Hi @Matt_Caruso - yes, you could do something like this:
  var notStarted = 0;


  var inDev = 0;


  var inTest = 0;


  var completed = 0;


  dataArray.forEach(function(element) {


    if (element.fields.Status == 'Not Started') {


      notStarted = notStarted + 1


    } else if (element.fields.Status == 'In Development') {


      inDev = inDev + 1


    } else if (element.fields.Status == 'In Testing') {


      inTest = inTest + 1


    } else if (element.fields.Status == 'Completed') {


      completed = completed + 1


    }


  });
Then write out the final values to the spreadsheet.
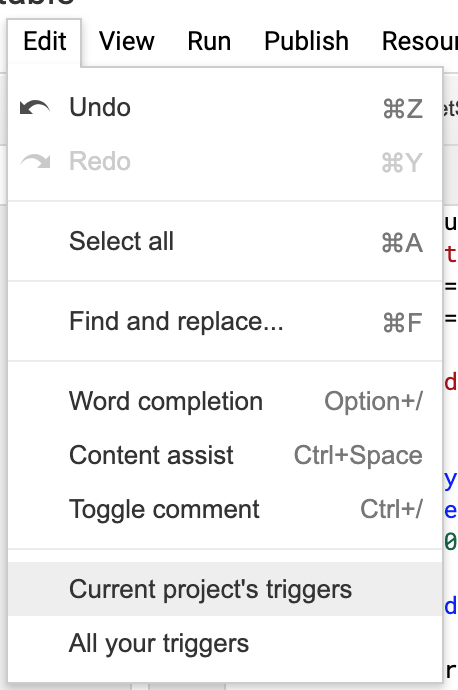
For the trigger, go to Edit -> Current Project’s Triggers in the script editor:

From here you can create a new trigger to run on a schedule.
This solution is definitely a bit more “codey” so may not be to everyone’s taste. For sure, @Cameron_Deleone’s Zapier solution is pretty nice (I have to confess I hadn’t figured out that the Zapier “find a record” action could be used in this way, to pull out all records). More generally, I have been trying to find a place to host API calls - using JS apps on glitch.com or other platforms for example - but nothing was really working for me. However, Google Scripts seems like a nice choice if you want to do something that can’t be done with Zapier.
Hi @Matt_Caruso - yes, you could do something like this:
  var notStarted = 0;


  var inDev = 0;


  var inTest = 0;


  var completed = 0;


  dataArray.forEach(function(element) {


    if (element.fields.Status == 'Not Started') {


      notStarted = notStarted + 1


    } else if (element.fields.Status == 'In Development') {


      inDev = inDev + 1


    } else if (element.fields.Status == 'In Testing') {


      inTest = inTest + 1


    } else if (element.fields.Status == 'Completed') {


      completed = completed + 1


    }


  });
Then write out the final values to the spreadsheet.
For the trigger, go to Edit -> Current Project’s Triggers in the script editor:

From here you can create a new trigger to run on a schedule.
This solution is definitely a bit more “codey” so may not be to everyone’s taste. For sure, @Cameron_Deleone’s Zapier solution is pretty nice (I have to confess I hadn’t figured out that the Zapier “find a record” action could be used in this way, to pull out all records). More generally, I have been trying to find a place to host API calls - using JS apps on glitch.com or other platforms for example - but nothing was really working for me. However, Google Scripts seems like a nice choice if you want to do something that can’t be done with Zapier.
@JonathanBowen I can certainly relate to the “where to host this code” debate. I end up using Zapier for this, too (the “code by Zapier” action supports both python and javascript).
Side note: at least as helpful as being able to execute API calls from somewhere is being able to listen to webhooks from other services without all the configuration that entails (much less straightforward than making outbound calls from a local machine). Zapier can handle that as well.


