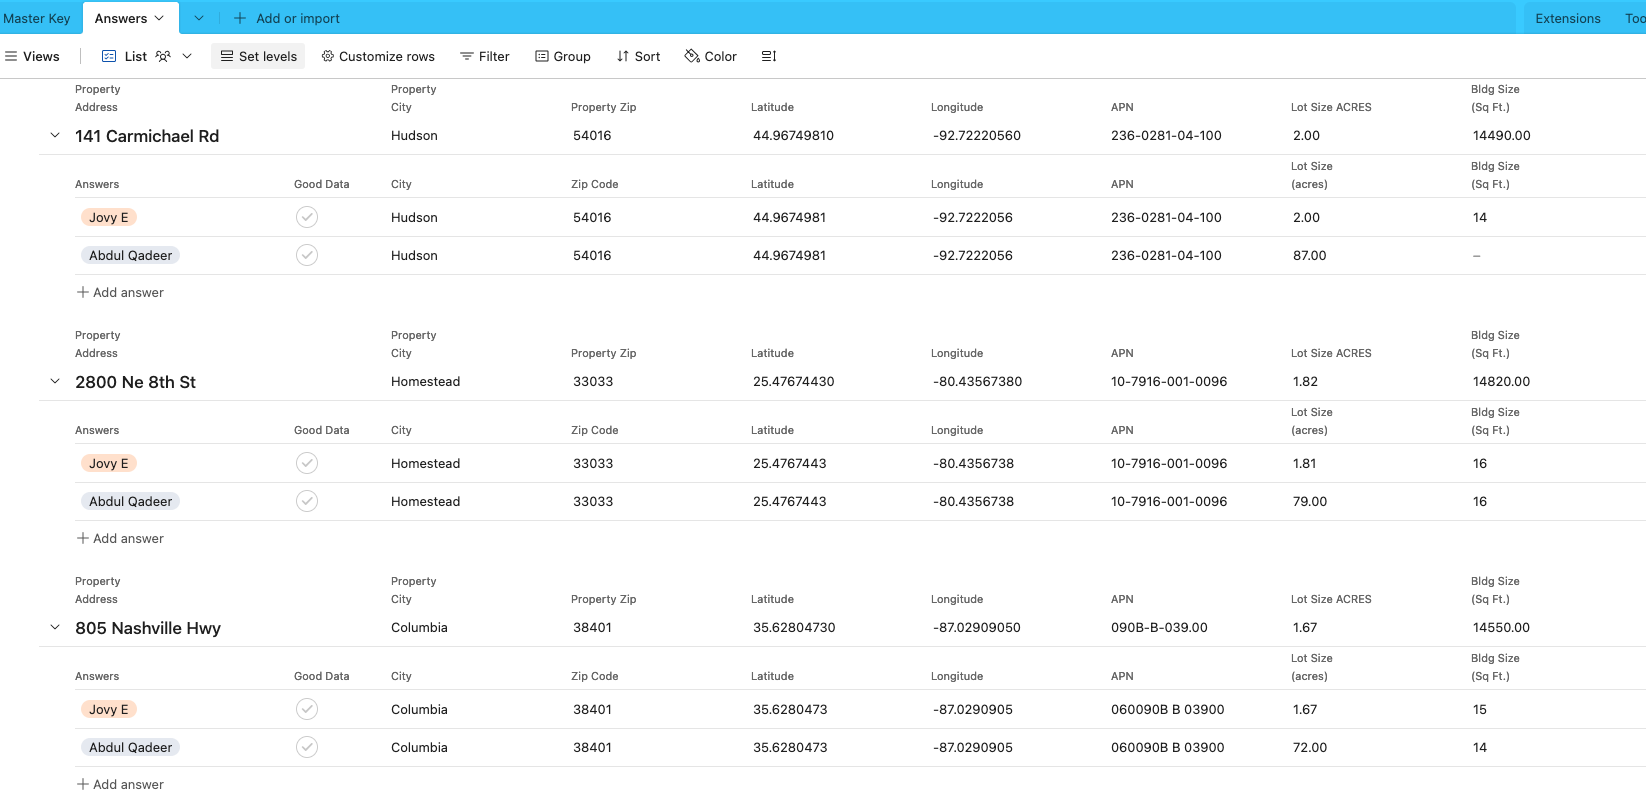
Link to video talk thru:
https://share.zight.com/2NuoL7de
I am currently in the process of comparing some Upwork freelancers who are helping me with researching the Ownership of commercial properties in the US, and contact information for those owners. Before embarking on a larger (and more costly) project of 40,000 properties, I had several providers run a Trial with 100 Properties, all of which I know the owners and their contact information.
I'm trying to figure out who to somewhat normalize the data and compare each provider's results with my data, so that I can pick the right partner.
Not sure how to do it, but I'm looking to have an accuracy % for each Provider for each field and in total.
My thinking is something along the lines of importing it all into a new base, somehow using the Property Address as the Grouping field, and showing my MASTER ANSWER key and all 8 data files from the service providers and using Conditional Formatting compared to the MASTER to color code for exact matches...but somehow work in a check box or spot check to manually override and count something as "correct"
This link should provide you all data files in both Excel and .csv
https://www.dropbox.com/scl/fo/qarmr2gnc06ysusiozzli/AHfkQr0cT0IVr-L09wcG8Is?rlkey=lsue985t0evae12lluedua6nv&dl=0
Would very much welcome and appreciate ideas and discussions from this wonderful community!


