Help

Re: Replicating Excel's and Google Sheets' SUMIF in AirTable

Solved
Jump to Solution
994 1
cancel
Showing results for 
Search instead for 
Did you mean: 
Robert_Kolodzie
5 - Automation Enthusiast

Hi everyone. I’ve been banging my head against this for a while now and decided to ask the community.

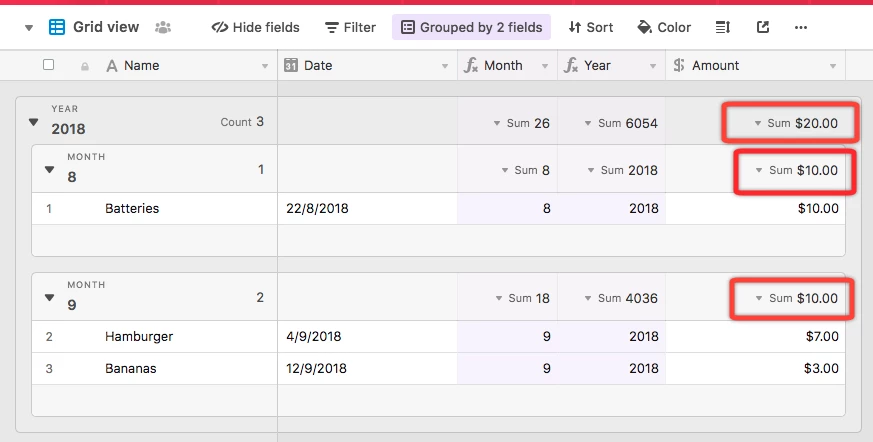
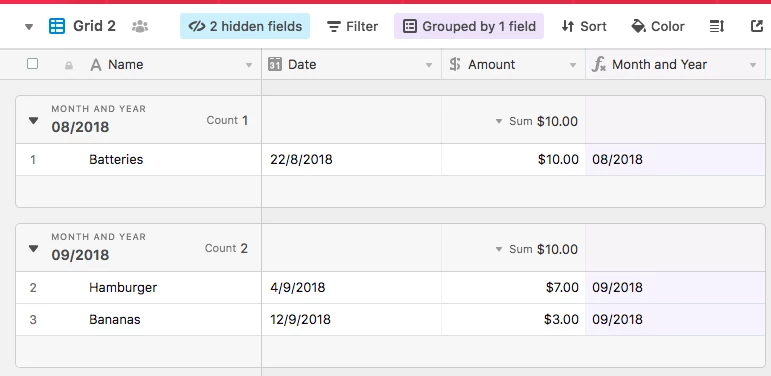
In Google Sheets I had a spreadsheet with 2 sheets. One was holding expenditures and with dates, and a formula was used to derive a month and year of the expense. (5/2018, 6/2018, etc). So in an example where I had multiple expenses in a month each would have a separate line with the date, amount (column G), some description, and at the end the ‘month’ formula field (column H).

The second sheet had a 1st column of all months/years value since the records began (Column A), and then a SUMIF(Sheet1!H:H,An,Sheet1:G:G)

I’ve got the tables set up in AirTable, just trying to get the last table to add up all values of a specified column if another column has the same value as the row’s first column in the new table.

Hope this makes sense … Can it be done?

1 Solution

Accepted Solutions
Elias_Gomez_Sai
13 - Mars
13 - Mars

You could also use Grouping, easy and flexible. Moreover, you have Yearly sums.

Captura de pantalla 2018-09-24_12-30-54_p. m..png

You could do the same but combined, as you described:

Captura de pantalla 2018-09-24_12-35-16_p. m..png

See Solution in Thread

6 Replies 6
Pete_Bragansa
4 - Data Explorer
4 - Data Explorer

kind of pathetic that no expert said anything here. Is airtable not capable of SUMIF from another table?

No, but I think you could make the IF in the original table and then add a Rollup in the other.

Also, you can see Sums at the bottom of the columns, and you could also create Views with Filters to work like with an IF.

Not sure if or how this would work.

In my example:
Column 1 has date of purchase
Column 4 has the amount
Column 5 has a derived M/YYYY value to allocate to the correct month

Table 2 has Column 1 with all M/YYYY values I’m recording details for. Column 2 has to be looking up the Amount (Table1.Column 4) value, where Table2.Column5 value equals that of the Table2.Column1.

Elias_Gomez_Sai
13 - Mars
13 - Mars

You could also use Grouping, easy and flexible. Moreover, you have Yearly sums.

Captura de pantalla 2018-09-24_12-30-54_p. m..png

You could do the same but combined, as you described:

Captura de pantalla 2018-09-24_12-35-16_p. m..png

Elias

I had shelved AirTable for a few months because I couldn’t get it working and then life got busy. Just came back to this, and you’re right. I can just do this as a new view with grouping. No need to create a new table with that data as it’s already there!

That’s awesome and I’ve achieved the desired result now.

I can now build on this and would be able to create a graph of the totals for each month/year combination?

Thank you for your help with this so far!

To get a graph for totals on month/year, you could create a view specifically for graphing a period of time that you want to see. Maybe call the view “Graph Period” or something, and then apply a filter to show only a particular date range. Then create a Chart Block based on that view. When you need to see the graph of a particular time period, just adjust the filter, and the Chart Block will update to match your new data.