How much of that is Airtable, how much is “other tools”, and how much is your own ingenuity? (I’m guessing there is quite a bit of all three, but heavily lean on the last one.)
How much of that is Airtable, how much is “other tools”, and how much is your own ingenuity? (I’m guessing there is quite a bit of all three, but heavily lean on the last one.)
Whatca doing in London?
I beg to differ. I’m an ordinary, every-day accountant who was drummed out of the CPA world because my auditing approach was too “automated”. I use tools that make me look like a genius and as Dennis Miller once said, it’s better to look good than feel good.
100% of the data is Airtable. :winking_face:
100% of the rest is not Airtable. :winking_face:
Typically, mapping apps can be divided into two essential categories for business use. Ironically, a key decision point for many growing companies is deciding how best to achieve location and data science objectives in two distinct realms -
Operational analytics
Strategic analytics
The operational realm (#1) is the clime of tools intended to help operationally-focused workers get their jobs done - i.e., an enterprise solution designed for repeated and consistent application of real-time data to effectuate hyper-performance. Generally, you find these addressed by things like Airtable Extensions.
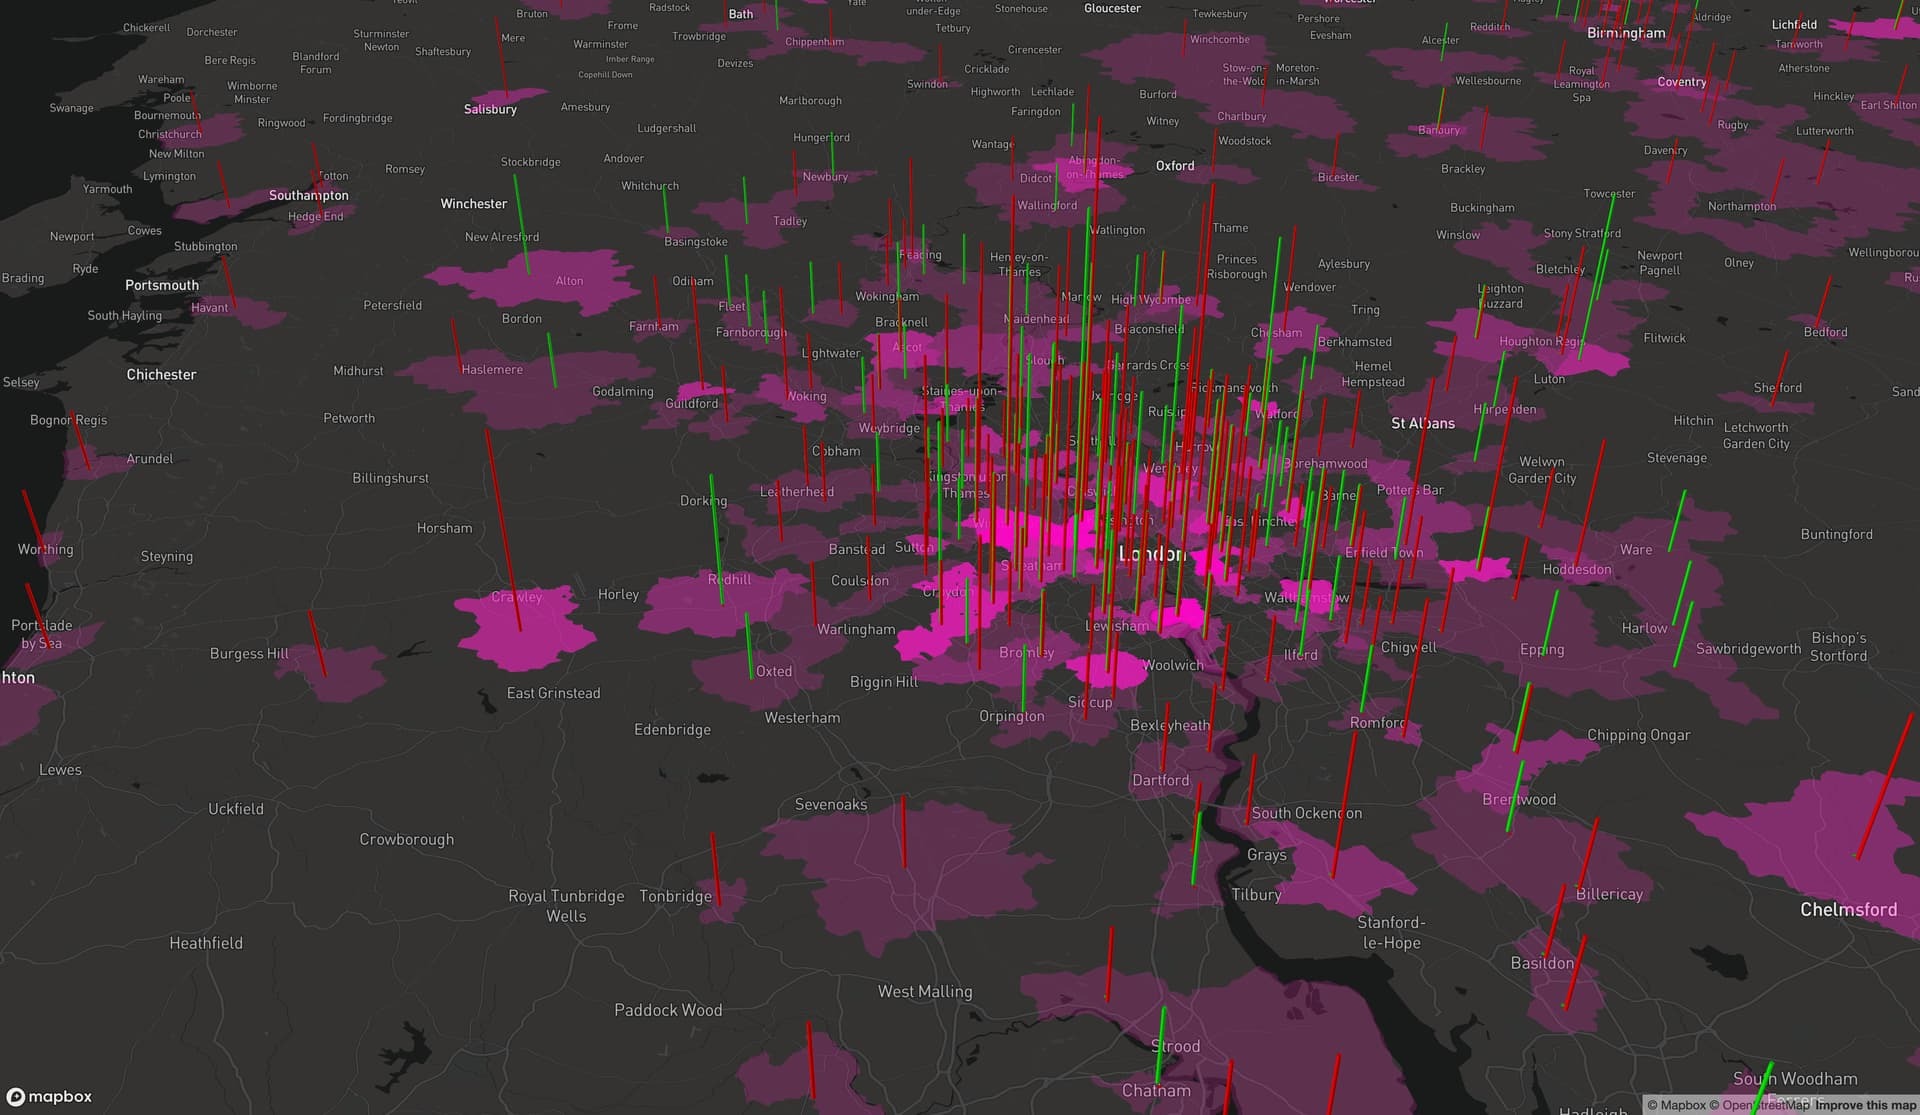
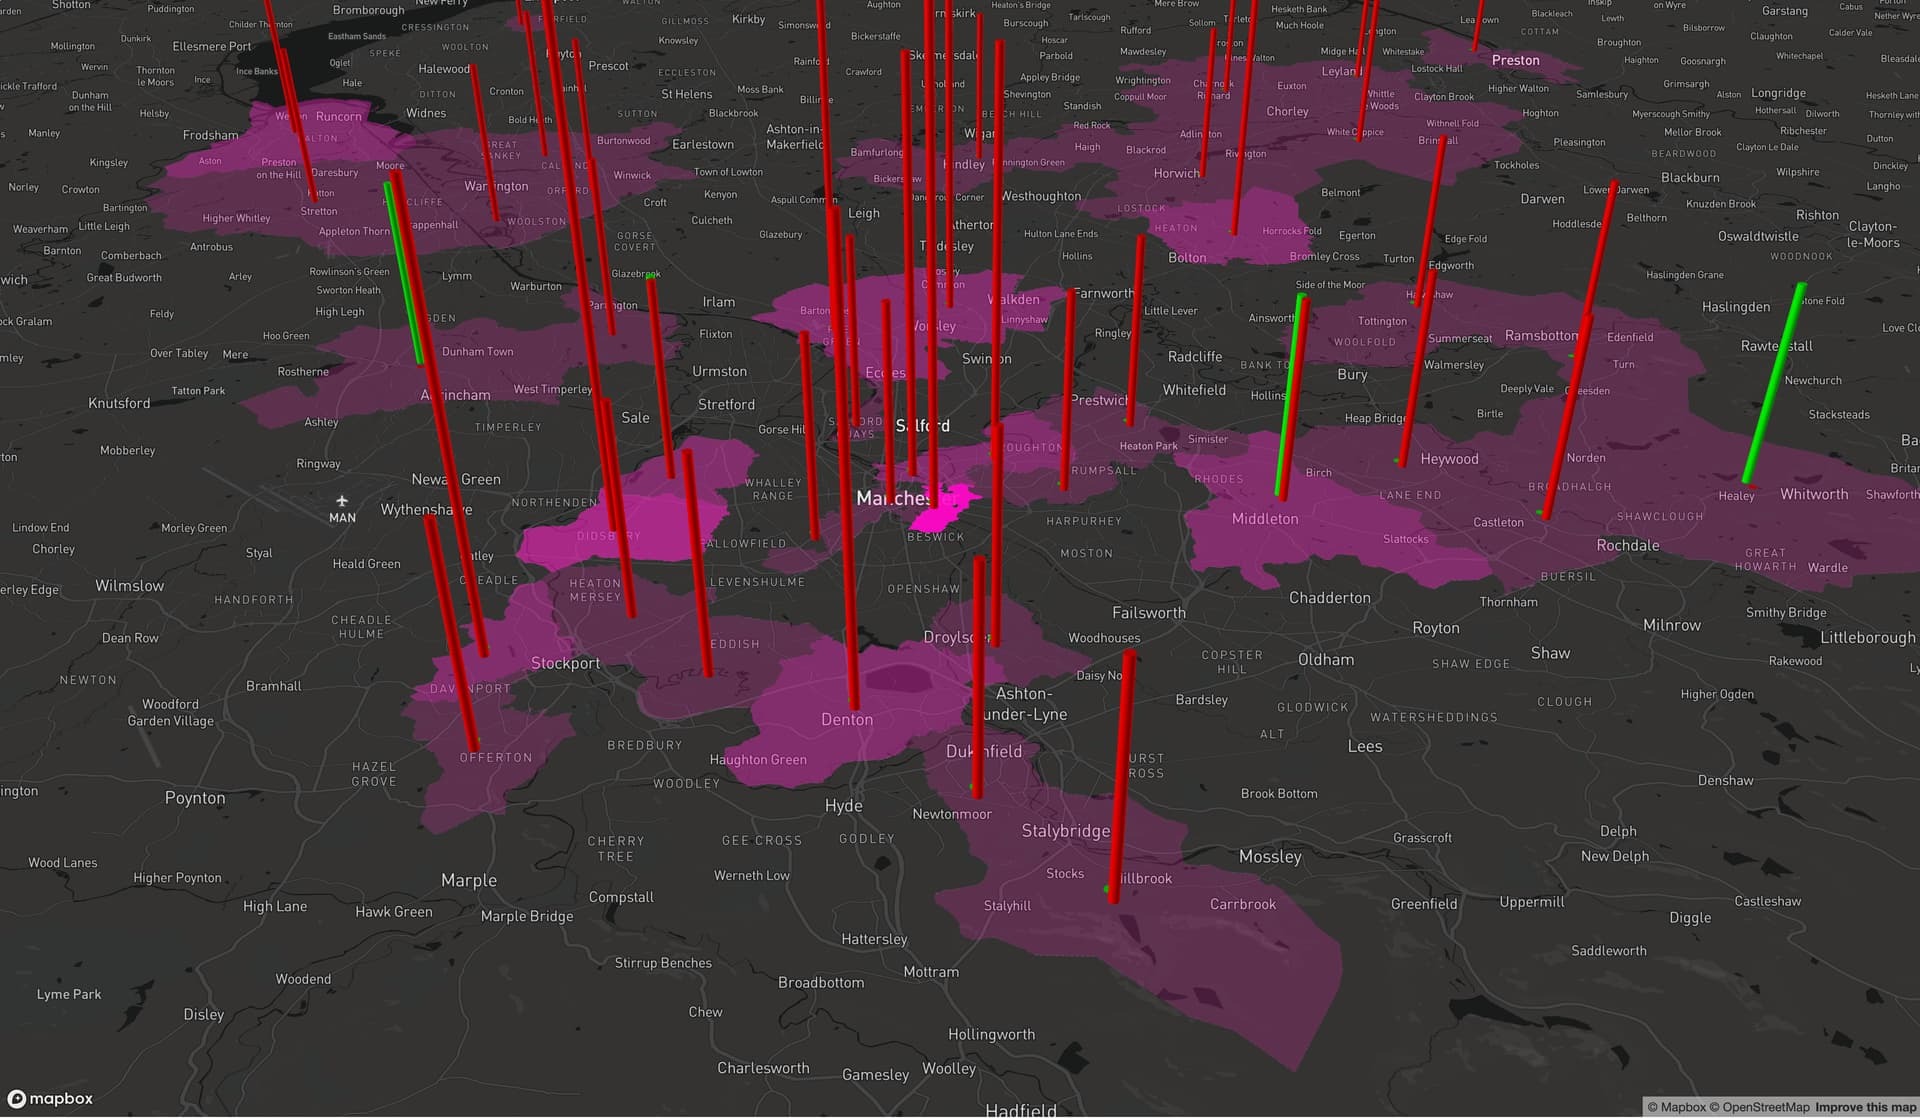
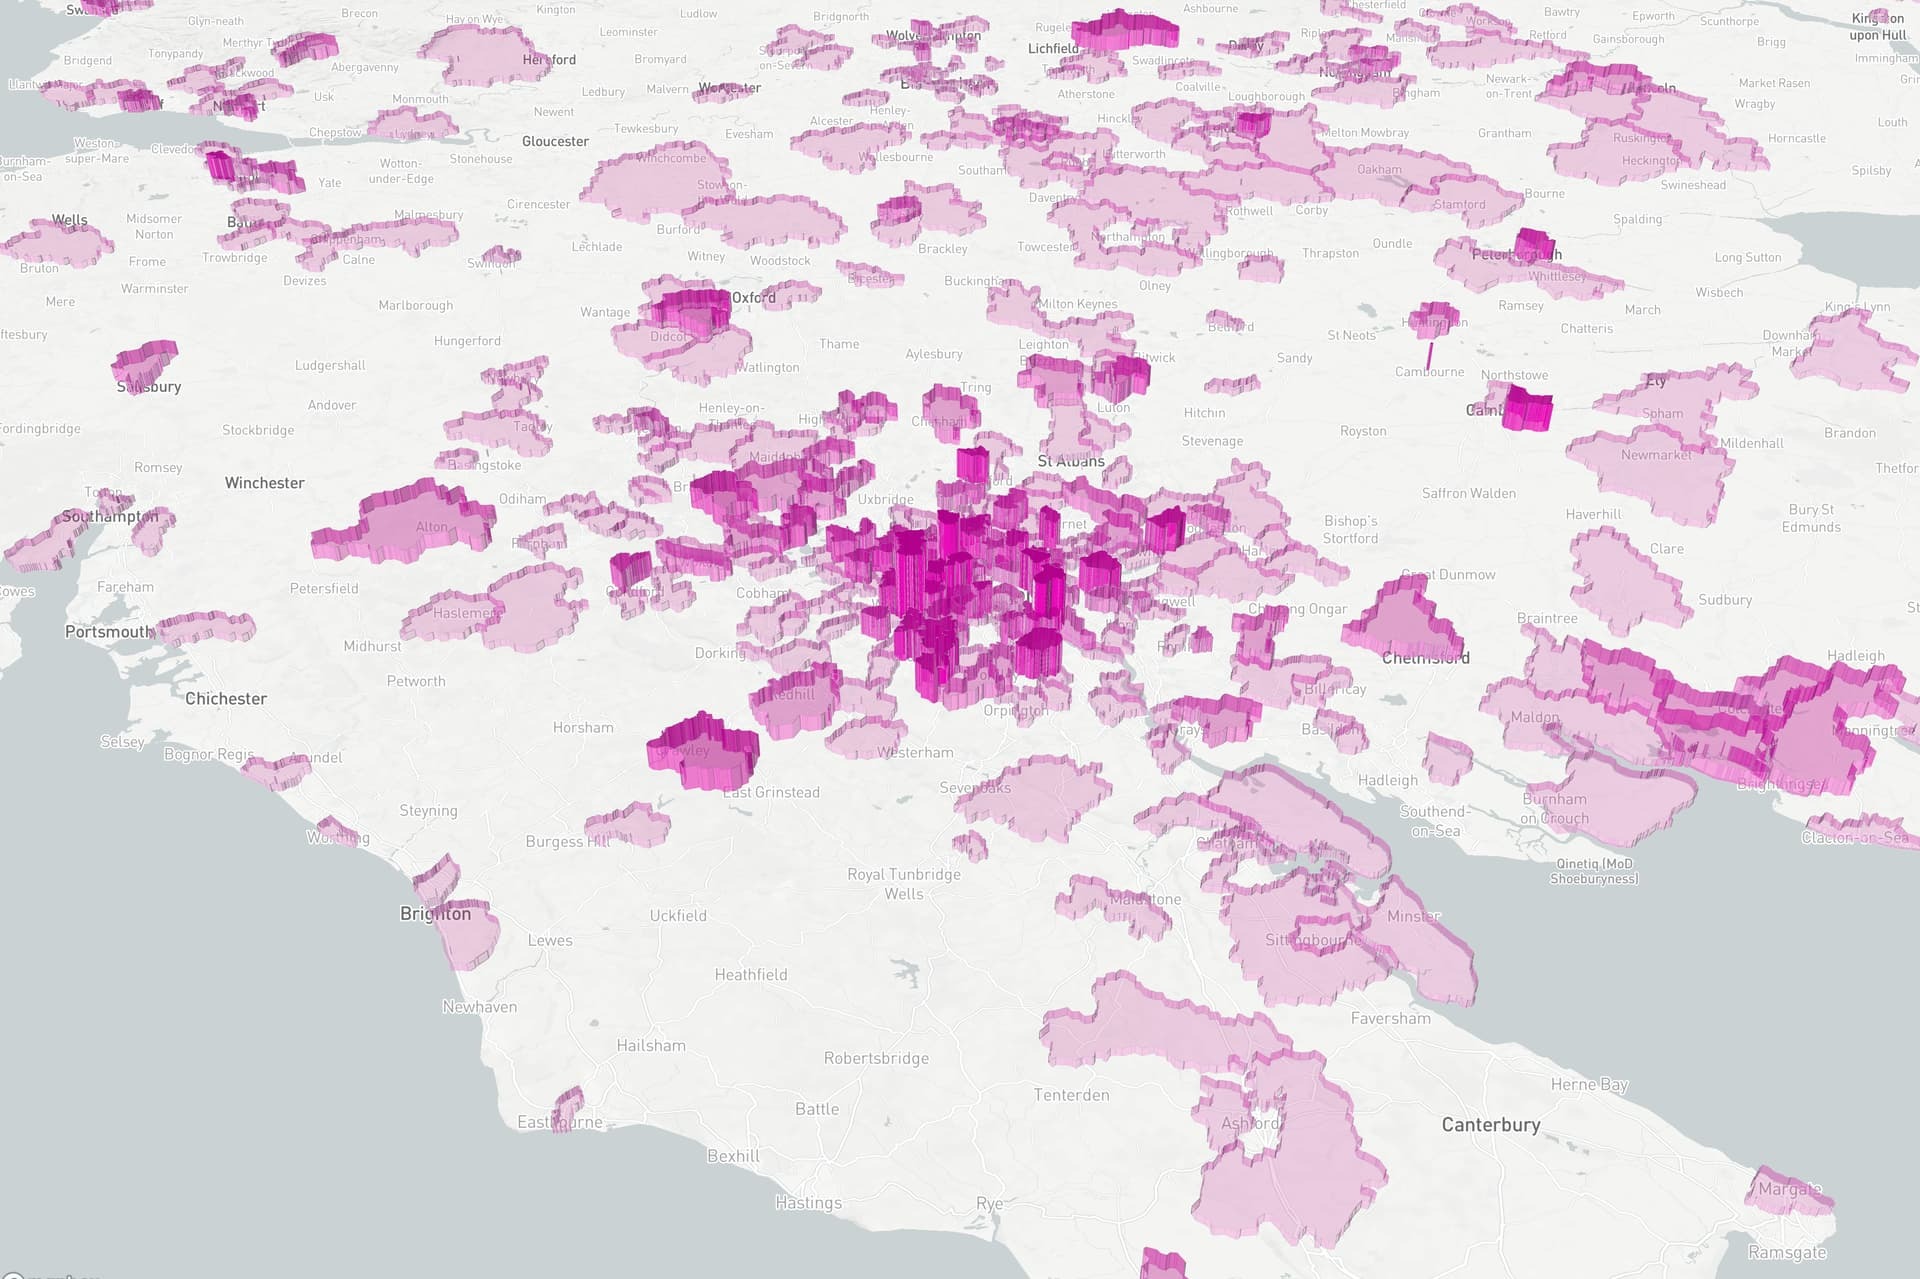
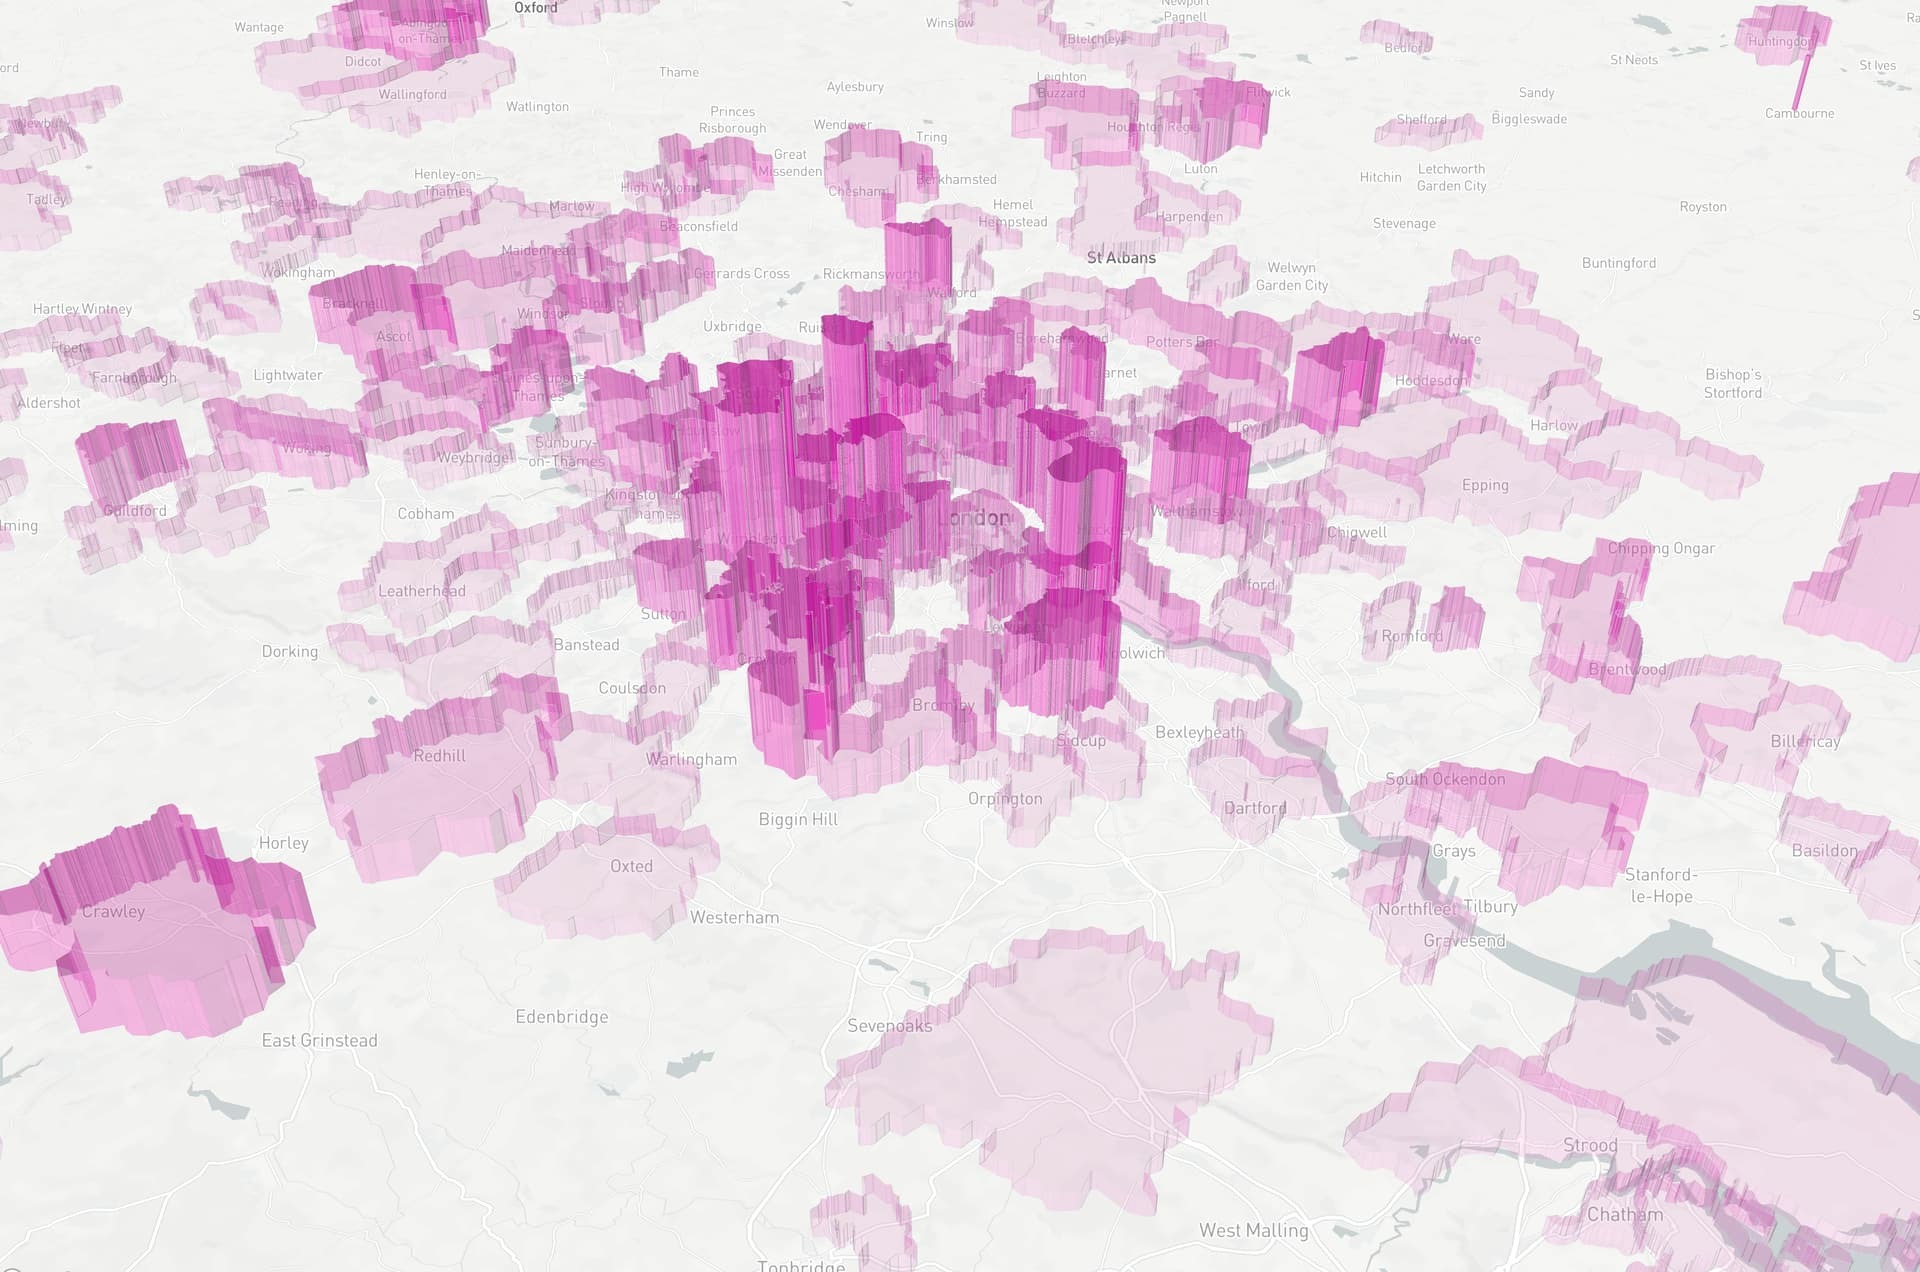
In contrast, the strategic realm (#2) is more fluid, often changing and adjusting to embrace big piles of data to understand trends and market patterns to make predictions. The data needed for strategic analytics is almost never modelled identically to the operational systems. The app shown above is an example of how to do that type of work. Operational apps based largely on custom code that integrates – say Airtable with Mapbox – are unable to hold up against the massive horizon of data-at-rest and fluid changes, and therefore should not be burdened with strategic interests.
I beg to differ. I’m an ordinary, every-day accountant who was drummed out of the CPA world because my auditing approach was too “automated”. I use tools that make me look like a genius and as Dennis Miller once said, it’s better to look good than feel good.
100% of the data is Airtable. :winking_face:
100% of the rest is not Airtable. :winking_face:
Typically, mapping apps can be divided into two essential categories for business use. Ironically, a key decision point for many growing companies is deciding how best to achieve location and data science objectives in two distinct realms -
Operational analytics
Strategic analytics
The operational realm (#1) is the clime of tools intended to help operationally-focused workers get their jobs done - i.e., an enterprise solution designed for repeated and consistent application of real-time data to effectuate hyper-performance. Generally, you find these addressed by things like Airtable Extensions.
In contrast, the strategic realm (#2) is more fluid, often changing and adjusting to embrace big piles of data to understand trends and market patterns to make predictions. The data needed for strategic analytics is almost never modelled identically to the operational systems. The app shown above is an example of how to do that type of work. Operational apps based largely on custom code that integrates – say Airtable with Mapbox – are unable to hold up against the massive horizon of data-at-rest and fluid changes, and therefore should not be burdened with strategic interests.
It is possible to be both.
But since appearance are more important, I also agree that you look like a genius, in addition to being one.
So you are storing the data in Airtable, but using other tools to analyze the data and make the pretty pictures?
But since appearance are more important, I also agree that you look like a genius, in addition to being one.
So you are storing the data in Airtable, but using other tools to analyze the data and make the pretty pictures?
Yes. This is absolutely a requirement. Imagine a process where 500 new [daily] events are added to the analytical data set. And the data set already contains 500,000 items. How do you create an analytics environment that is always caching-forward the new data on top of the historical data such that the app is performant? You need edge tools/client apps that are capable of remembering the past while adding the present without breaking stride.