Hi,
Your approach is not good, because you need to create extra field for every next day.
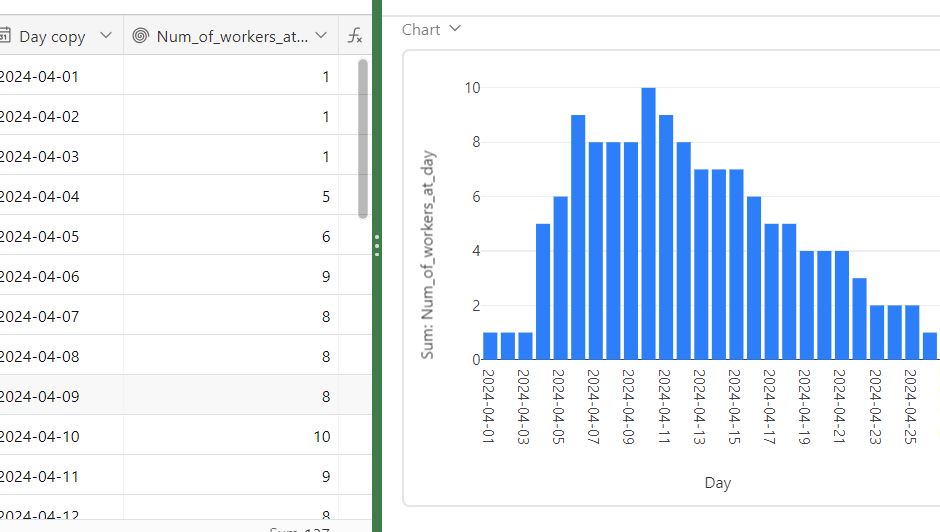
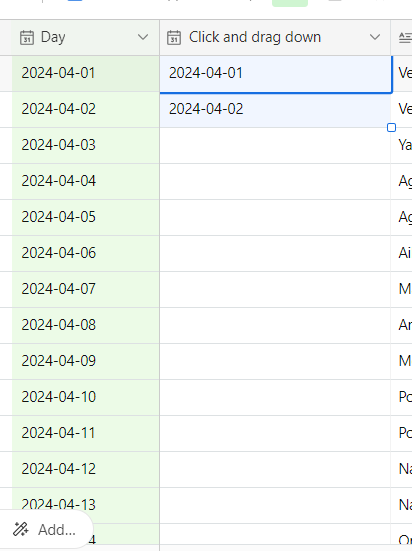
Better solution is to create the table of days. You can put first date in the primary field of the first record, then put next day in the second record,
then select these two cells,
then click on little square at right-down of the cell and drag it down to the number of days you need
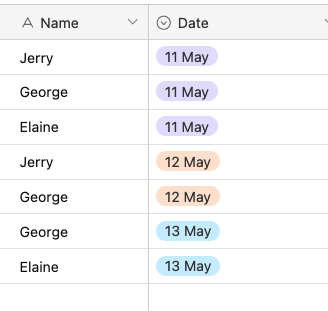
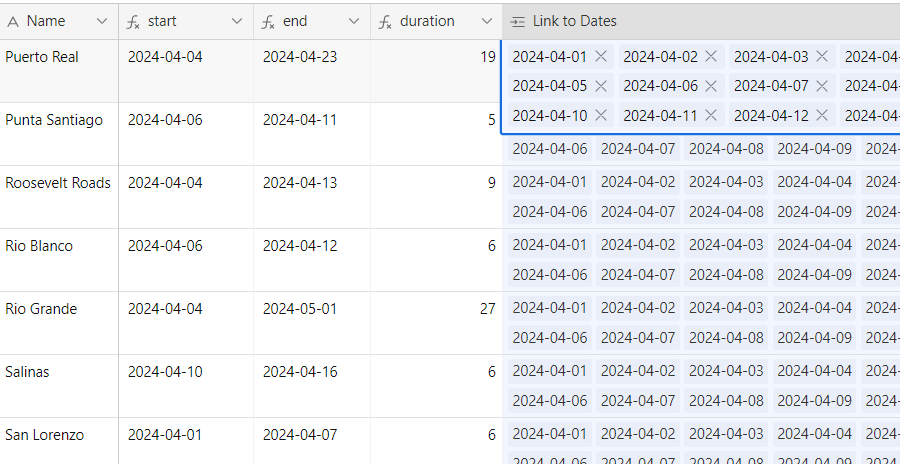
Link this table to a table of workers. Create link field, then add first worker, then copy the cell and paste it to whole field. (I just took random table of values and 30 days of this month, to act as test data)
Ctrl+C
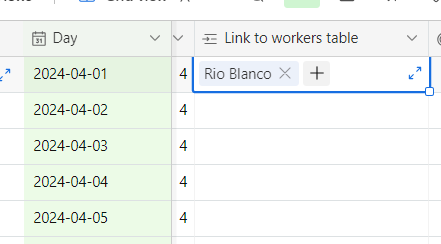
CTRL+V
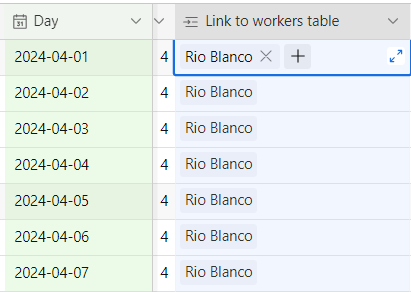
And now switch to workers table and do the same:
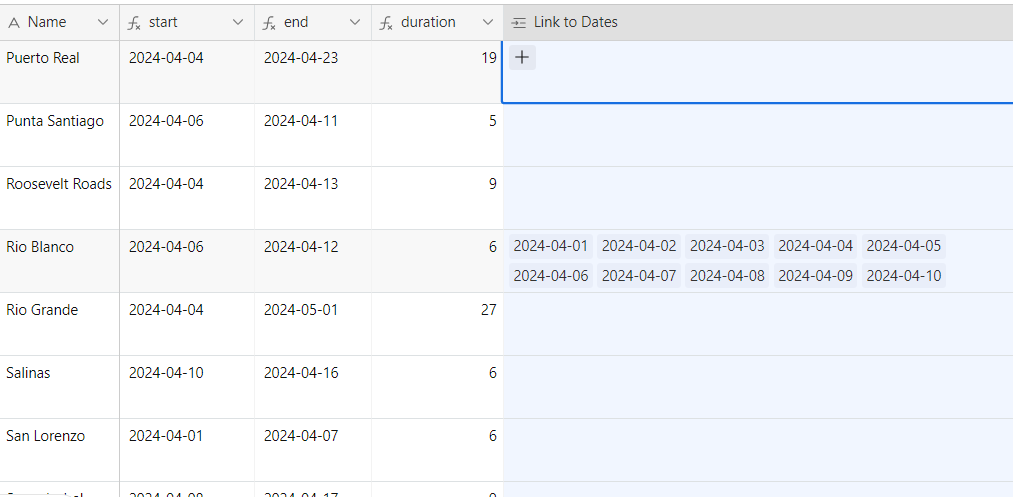
So, all workers will be linked to all dates
btw, add duration field,
DATETIME_DIFF(end,start,'days')Now, make formula to extract interval. I renamed 'Link to Days' to ALL_DATES to avoid mess in formula. So, we will find {starting date} and take that part, up to {end date}
At first, I did complex formula with FIND {start}, ALL_DATES and FIND {END} etc, but then realized function MID needs start position and char count. it doesn't need end position. And chart count can be taken from {duration}, ISO date is always 10 chars, plus comma and space. SO:
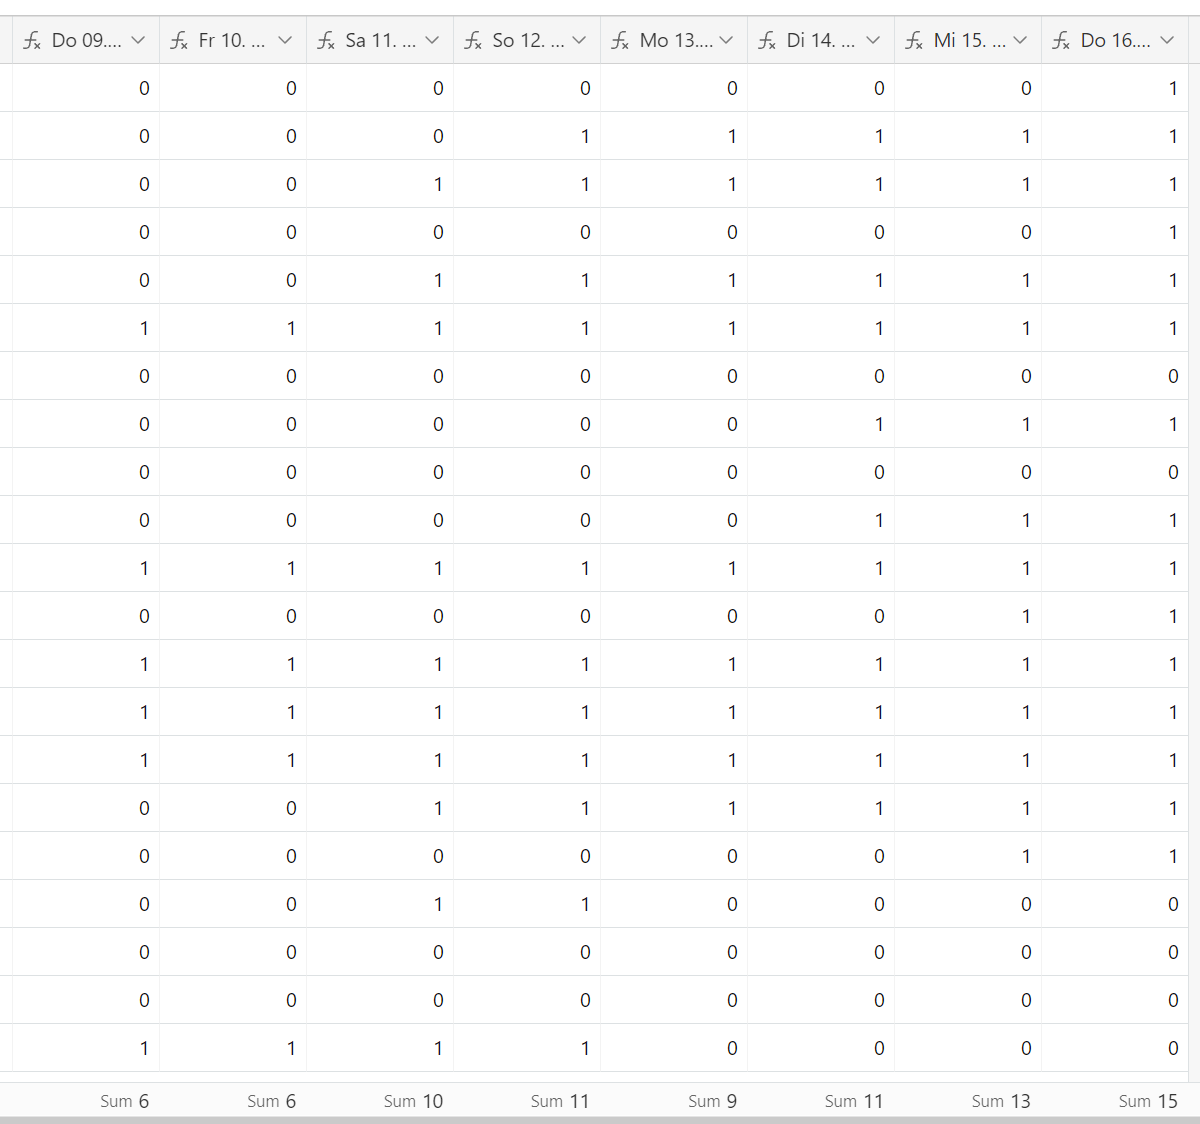
MID(ALL_DATES,(FIND(DATESTR(start),ALL_DATES)),12*duration)looks nice:
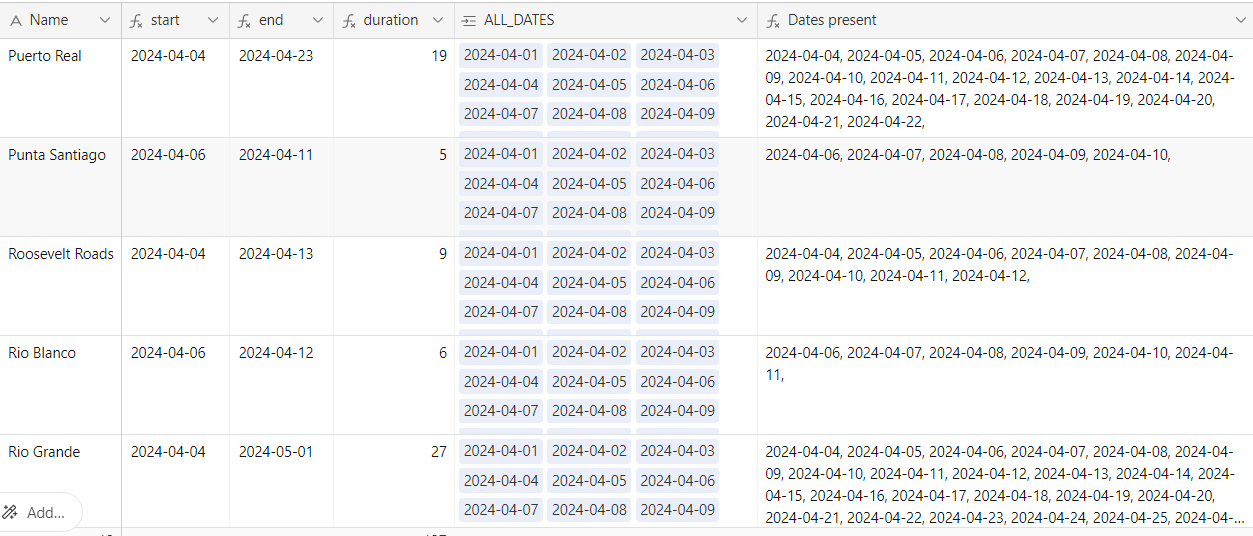
And the last thing, find how much given string included in a whole text (ROLLUP of Dates present). Substitute all occurences by '' , Substract LEN froma LEN of full text. Divide by the length of given string (10 in our case)
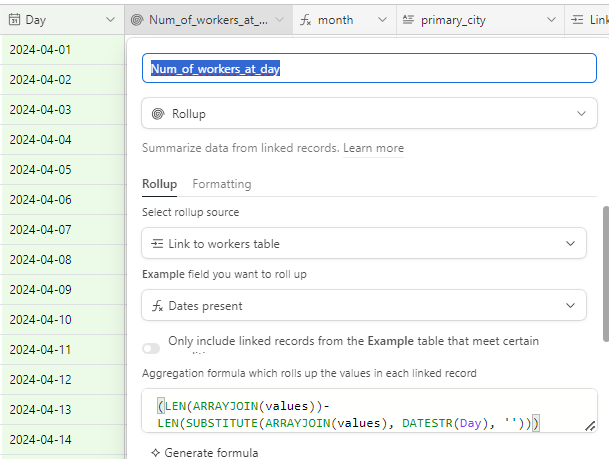
(LEN(ARRAYJOIN(values))-
LEN(SUBSTITUTE(ARRAYJOIN(values), DATESTR(Day), '')))/10
The advantage of this solution is ability to scale at any list of workers and list of dates, the only thing to be provided is correct linking - formulas will do the rest. Of course, if you take whole year and a list of 1000 people, such amount of links/formulas might crush the performance or hang the table.
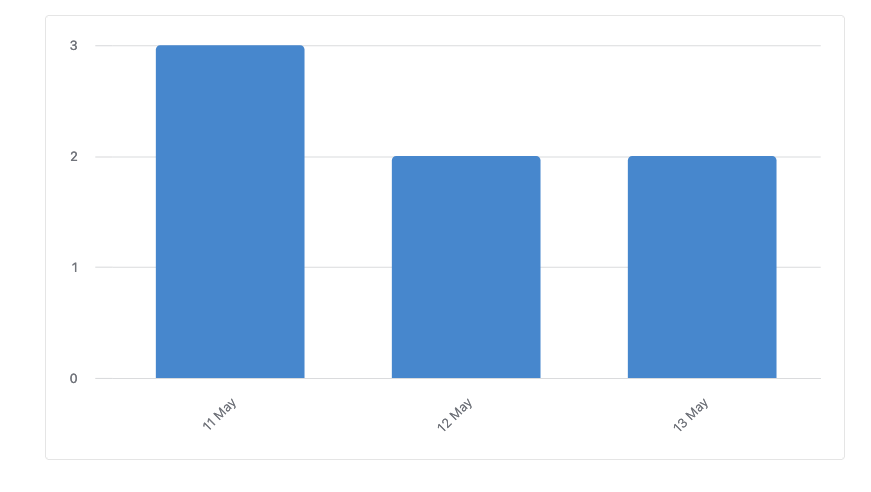
But that's another story, and now chart can be created: