
Hey guys,
We need to great a record in airtable that contains a graph like here in the image:
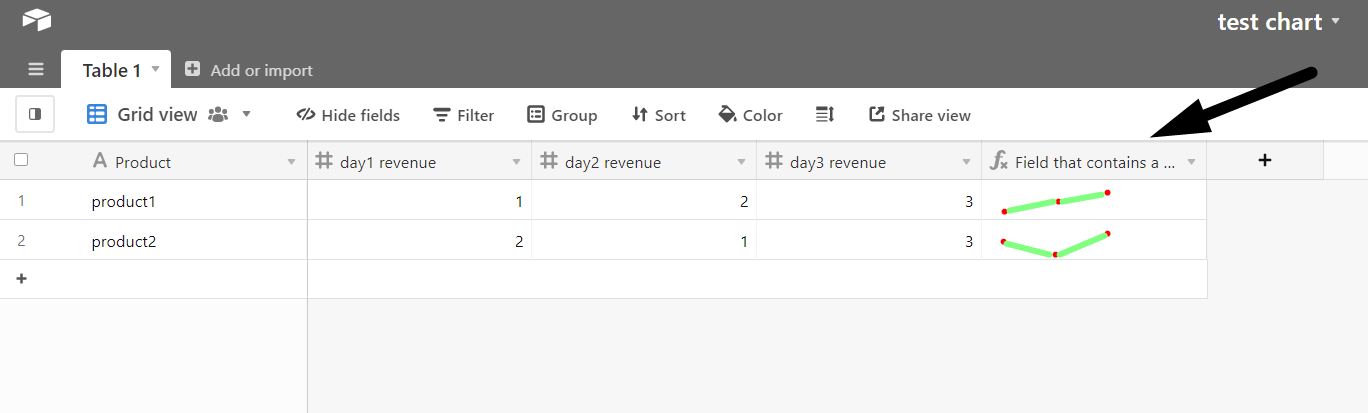
We use airtable as our website database
And we need to visually see graphs based on each record in the table (exactly as the image above)
How do we do that, Any creative ways you can think of?