Solved

Vega-Lite Stacked Bar Graph w/ Multiple Fields


Forum|alt.badge.img

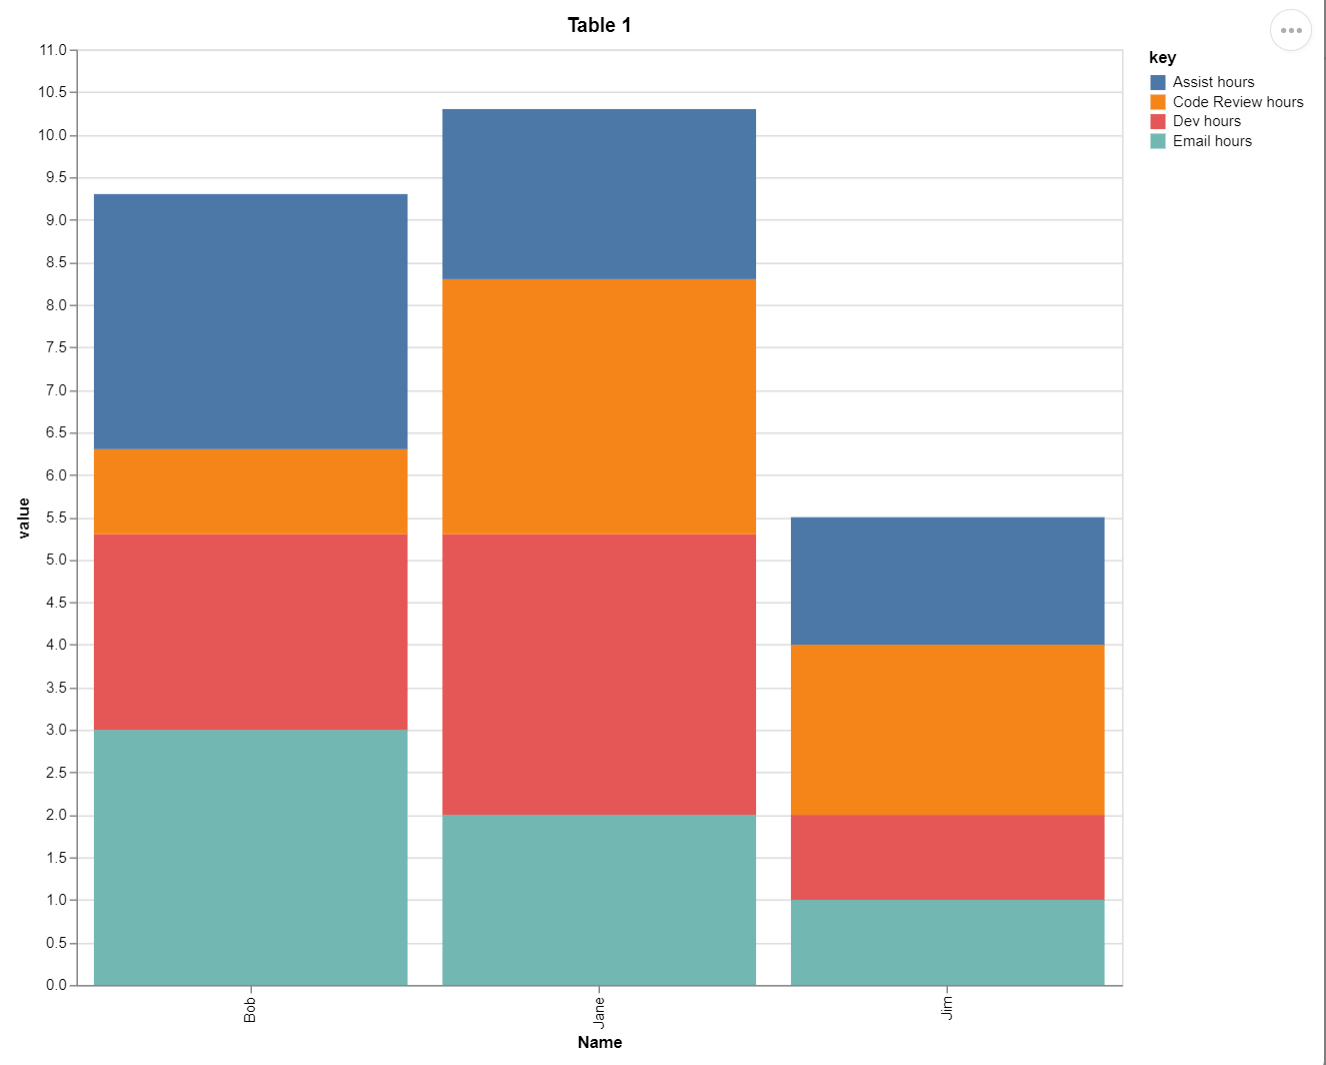
Hi everyone! I’m trying to work with the Vega-Lite extension to show sums of values in multiple fields in a stacked bar chart, but I haven’t been able to get a stacked bar graph to work correctly without manually creating a new “data” array of objects with values.

For example:

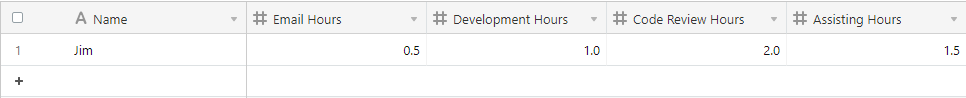
I’d like to be able to show something like “Jim worked for 0.5 hours on checking emails, 2 hours on code reviews, 1 hour on development, and 1.5 hours on assisting coworkers, for a total of 6 hours” as a stacked bar chart, where Jim has each number of hours as a different field on the table for a total of 4 fields and 4 bars stacked. Is this possible with Vega-Lite’s integration with Airtable, or even Vega-Lite as a whole? Or am I limited in either how many fields I can stack or how the table data is formatted?

Thanks in advance!

Best answer by Greg_F

Hi @Journey_Ebels ,

I used your data and added 2 more rows. Main point was using the transform and fold to create the array

{
  "$schema": "https://vega.github.io/schema/vega-lite/v4.json",
  "title": "Table 1",
  "width": "container",
  "height": "container",
  "transform": [
    {
      "fold": [
        "Email hours",
        "Dev hours",
        "Code Review hours",
        "Assist hours"
      ],
      "as": [
        "key",
        "value"
      ]
    }
  ],
  "mark": "bar",
  "encoding": {
    "x": {
      "field": "Name",
      "type": "nominal"
    },
    "y": {
      "field": "value",
      "type": "quantitative"
    },
    "color": {
      "type": "nominal",
      "field": "key"
    }
  }
}

This should look like it:

I hope this helps!

View original
Did this topic help you find an answer to your question?

3 replies

Greg_F
Forum|alt.badge.img+16
  • Inspiring
  • 141 replies
  • Answer
  • November 10, 2022

Hi @Journey_Ebels ,

I used your data and added 2 more rows. Main point was using the transform and fold to create the array

{
  "$schema": "https://vega.github.io/schema/vega-lite/v4.json",
  "title": "Table 1",
  "width": "container",
  "height": "container",
  "transform": [
    {
      "fold": [
        "Email hours",
        "Dev hours",
        "Code Review hours",
        "Assist hours"
      ],
      "as": [
        "key",
        "value"
      ]
    }
  ],
  "mark": "bar",
  "encoding": {
    "x": {
      "field": "Name",
      "type": "nominal"
    },
    "y": {
      "field": "value",
      "type": "quantitative"
    },
    "color": {
      "type": "nominal",
      "field": "key"
    }
  }
}

This should look like it:

I hope this helps!


Forum|alt.badge.img
  • Author
  • New Participant
  • 1 reply
  • November 10, 2022
Greg_F wrote:

Hi @Journey_Ebels ,

I used your data and added 2 more rows. Main point was using the transform and fold to create the array

{
  "$schema": "https://vega.github.io/schema/vega-lite/v4.json",
  "title": "Table 1",
  "width": "container",
  "height": "container",
  "transform": [
    {
      "fold": [
        "Email hours",
        "Dev hours",
        "Code Review hours",
        "Assist hours"
      ],
      "as": [
        "key",
        "value"
      ]
    }
  ],
  "mark": "bar",
  "encoding": {
    "x": {
      "field": "Name",
      "type": "nominal"
    },
    "y": {
      "field": "value",
      "type": "quantitative"
    },
    "color": {
      "type": "nominal",
      "field": "key"
    }
  }
}

This should look like it:

I hope this helps!


That’s perfect, thank you so much!


Forum|alt.badge.img+2
  • New Participant
  • 2 replies
  • May 19, 2023
Greg_F wrote:

Hi @Journey_Ebels ,

I used your data and added 2 more rows. Main point was using the transform and fold to create the array

{
  "$schema": "https://vega.github.io/schema/vega-lite/v4.json",
  "title": "Table 1",
  "width": "container",
  "height": "container",
  "transform": [
    {
      "fold": [
        "Email hours",
        "Dev hours",
        "Code Review hours",
        "Assist hours"
      ],
      "as": [
        "key",
        "value"
      ]
    }
  ],
  "mark": "bar",
  "encoding": {
    "x": {
      "field": "Name",
      "type": "nominal"
    },
    "y": {
      "field": "value",
      "type": "quantitative"
    },
    "color": {
      "type": "nominal",
      "field": "key"
    }
  }
}

This should look like it:

I hope this helps!


@Greg_F this is very helpful. Do you know if it is also possible to turn the stacked bars into 100% instead of sum/count? Many thanks


Reply