Hi everybody,
On my dashboard in Interfaces, I'd like to customize my bar chart this way (see attachments) :
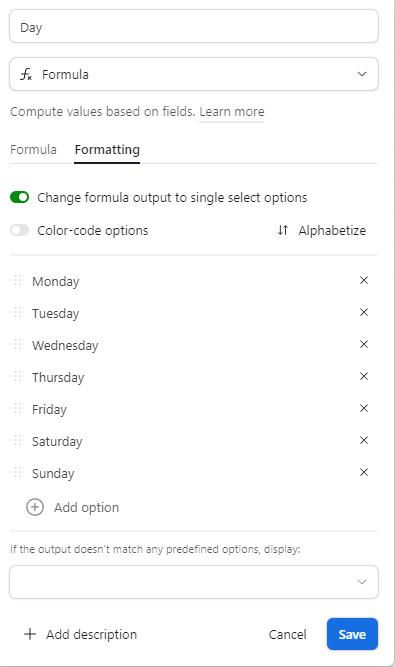
- all the days of the week are displayed on the X-axis and the '0' value is displayed if there are no outreach actions on that day
- display a goal line
- color-code the bars depending on the value range they fall into (red for 1-3, orange for 4-6, yellow for 7-9, green for 10 and above)
- have a sorting option in the 'Order' drop-down menu that automatically sort the week days in a chronological order => no need to put a digit as a prefix in the Week Day name
I didn't manage to get those things. Do you know if there are workarounds for my specific needs?
Thanks!

Customizing a Bar Chart in Interfaces
 +14
+14
Reply
Most helpful members this week
Enter your E-mail address. We'll send you an e-mail with instructions to reset your password.