Filtering from Main table having no effect on Calc table... Linked records
I have followed this to a tee but I am missing something here!
I have a table called Certified Partner Data (CPD). It is essentially my Main table from the exercise above. I have a field called TRIs in that CPD Table. I need to rollup the sum of that column.
I have created a Calc table and made it Link to CPD. I see all of records of CPD in one row of Calc.
I go back to CPD and create a Lookup field going back to the rollup in Calc of the TRIs.
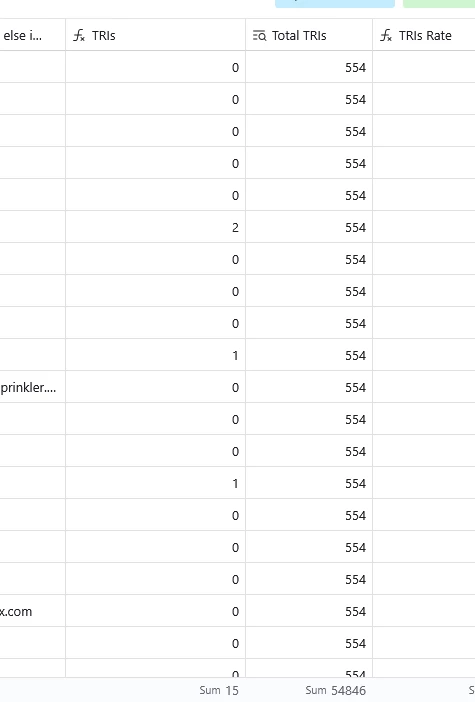
Below is what I see when I when I view CPD. I have it filtered to a single month and you can see the TRIs column = 15 (column total at bottom) yes my Total TRIs is showing 554. That is the total NON FILTERED. The filtering on CPD has no effect on the Calc results. I am SO close but can’t seem to get this part to work. I am filtering on a Single Select “Month”. Why is it not picking up the Filtering from CPD? And as always, thank you!
Page 1 / 1
Hey @Jon_Eynon,
I’m super confused with your example lol. Would you mind providing further detail or screenshots?
Yeah unfortunately filters on your main table don’t affect the rolled up data I’m afraid. To get monthly data like the way you want, you can try either of the following options and I’ve set it them up here for you to check out
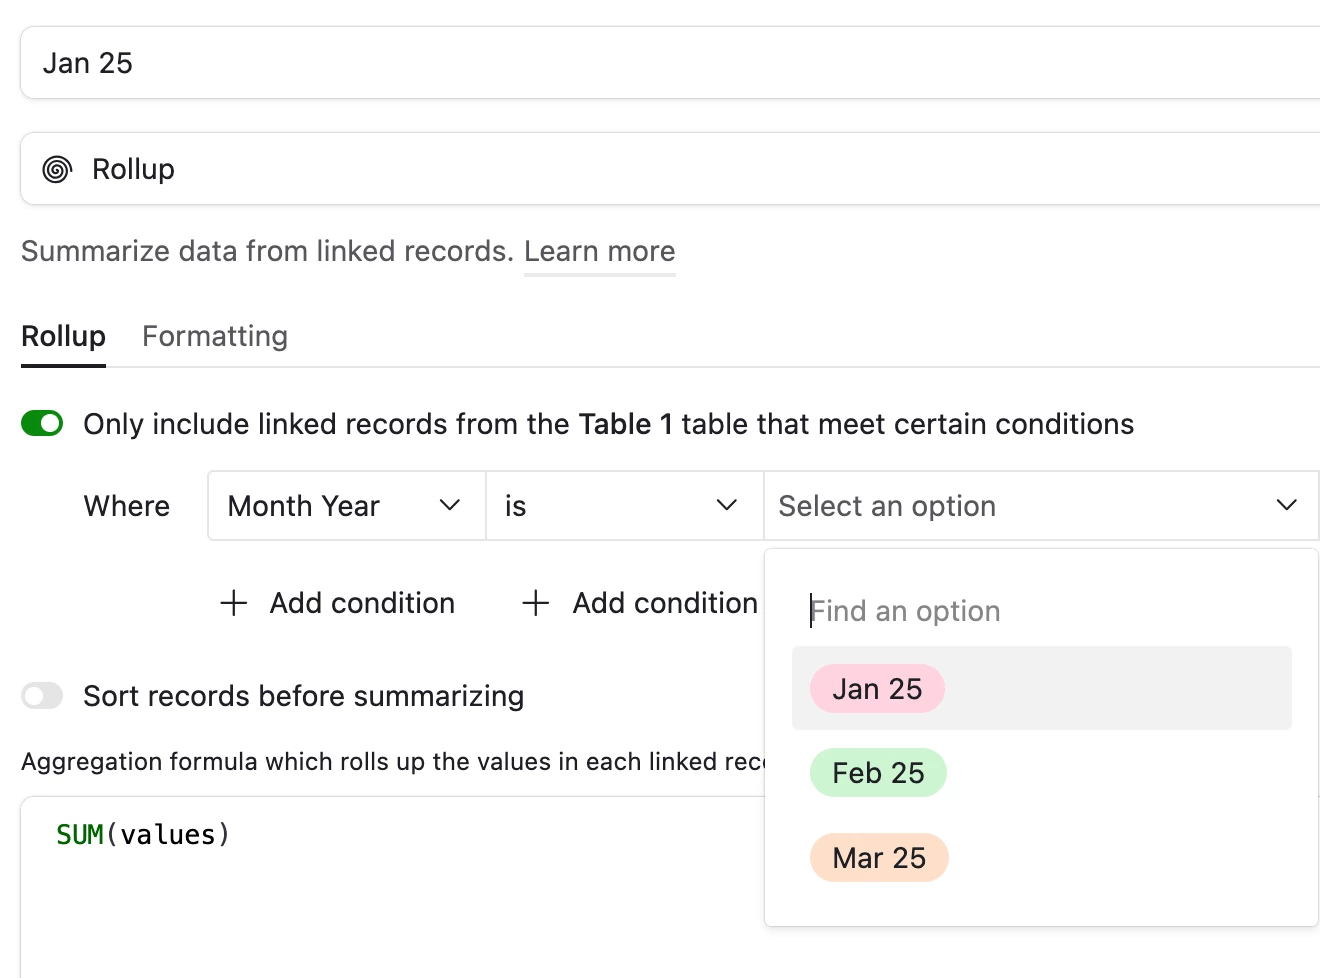
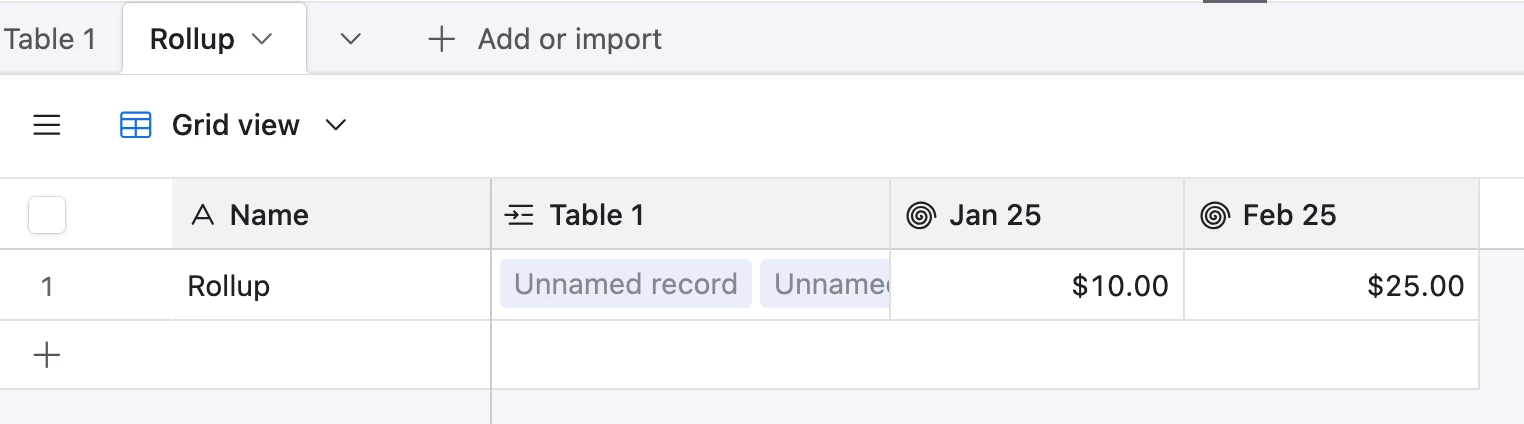
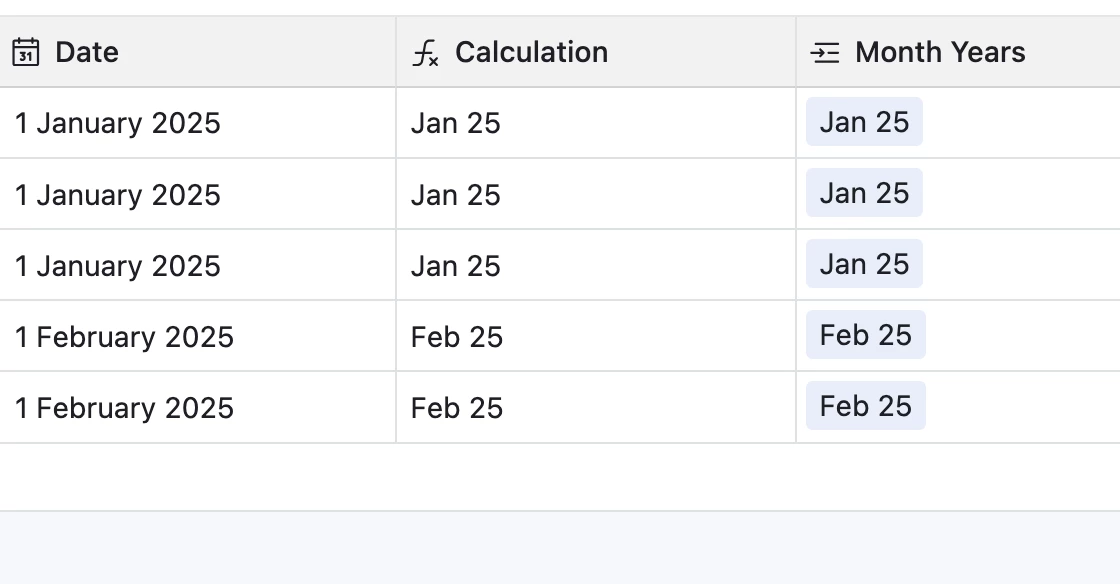
Creating one field per month year and using conditional filtering to handle it: Resulting in:
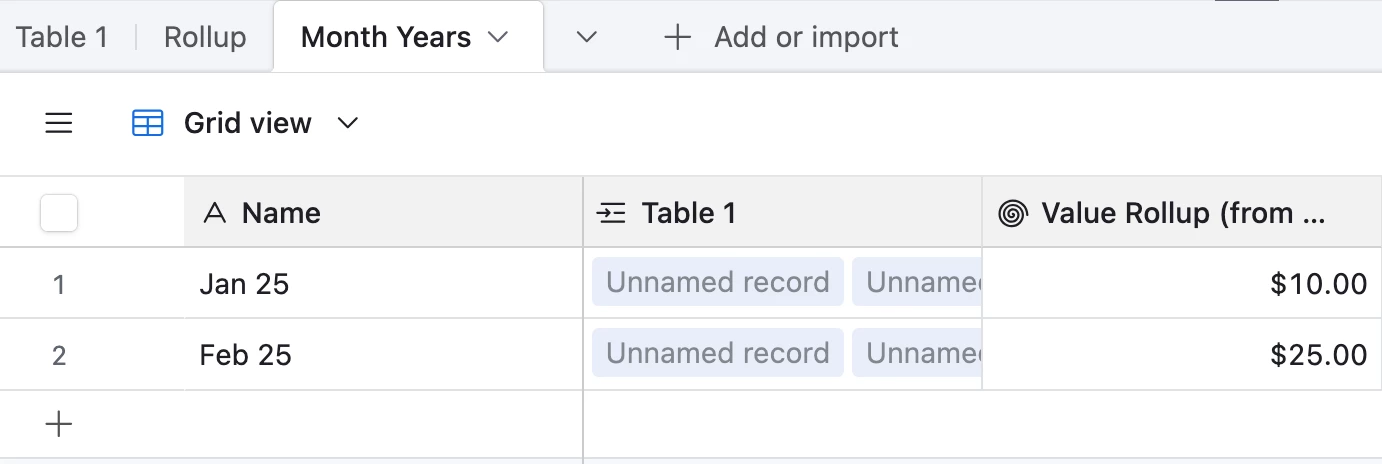
Creating a table where each record represents a month year value, and you’d populate this via an automation
The idea would be to have a formula field that outputs the Month Year value e.g. Jan 25, and have an automation paste that value into a linked field to that new table. How it triggers depends on how your data’s created though, for example if it’s from a form submission then you'd use the ‘On form submit’ trigger etc
Thanks to the two of you for reaching out. I will try and explain this a bit better.
I have a table where companies report, each month, safety details from job sites. Each company tells us how many man hours were worked and, if any injuries, what kind. Ignore the junkiness of the Month column in the example :)
The result is a monthly report that runs some calculations that come up with a rate of injury per month for the whole reporting group.
Equation for TRI rate: (TRIs * 200000)/Hours worked that month
Equation for DART rate (DARTs * 20000/Hours worked that month
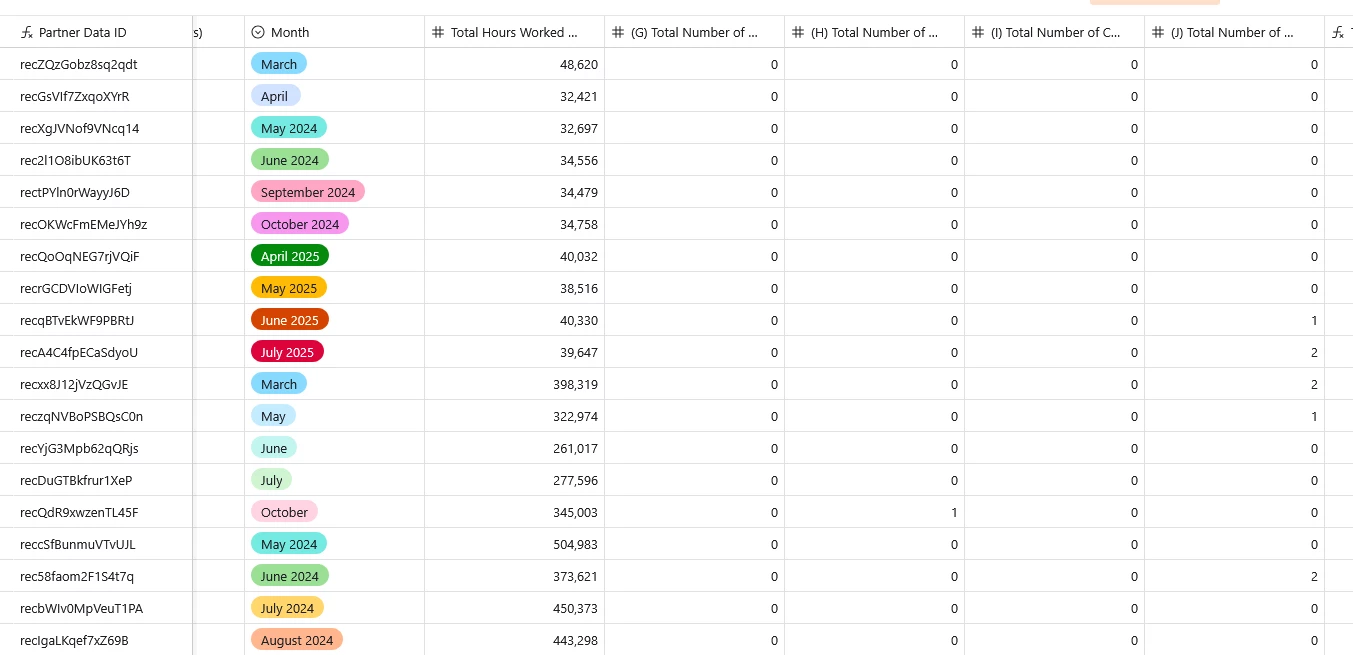
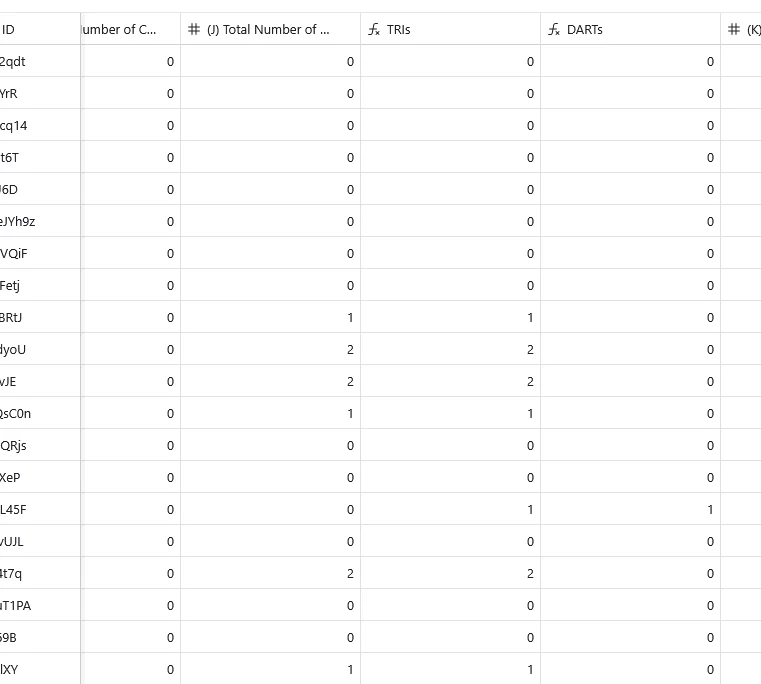
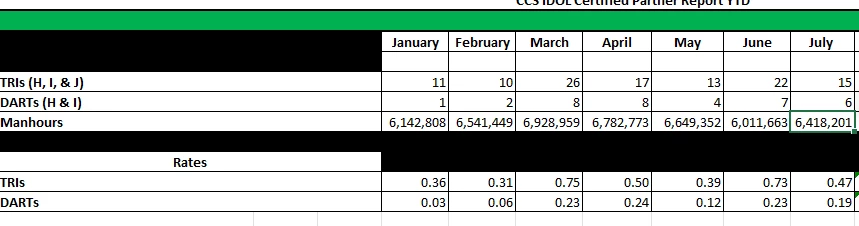
TRIs and DARTs are just a sum of some of the columns (see image below). For instance, in July 2025 we had 15 TRIs and 6 DARTS. We worked 6418202 hours. So doing the math we come up with a TRI Rate of .47 and a DART rate of .19
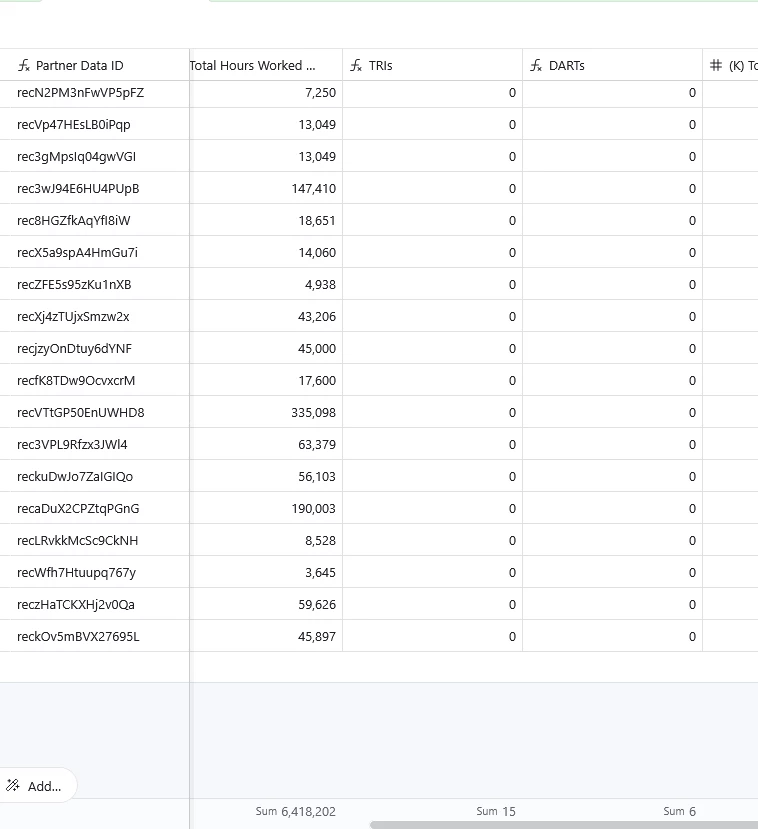
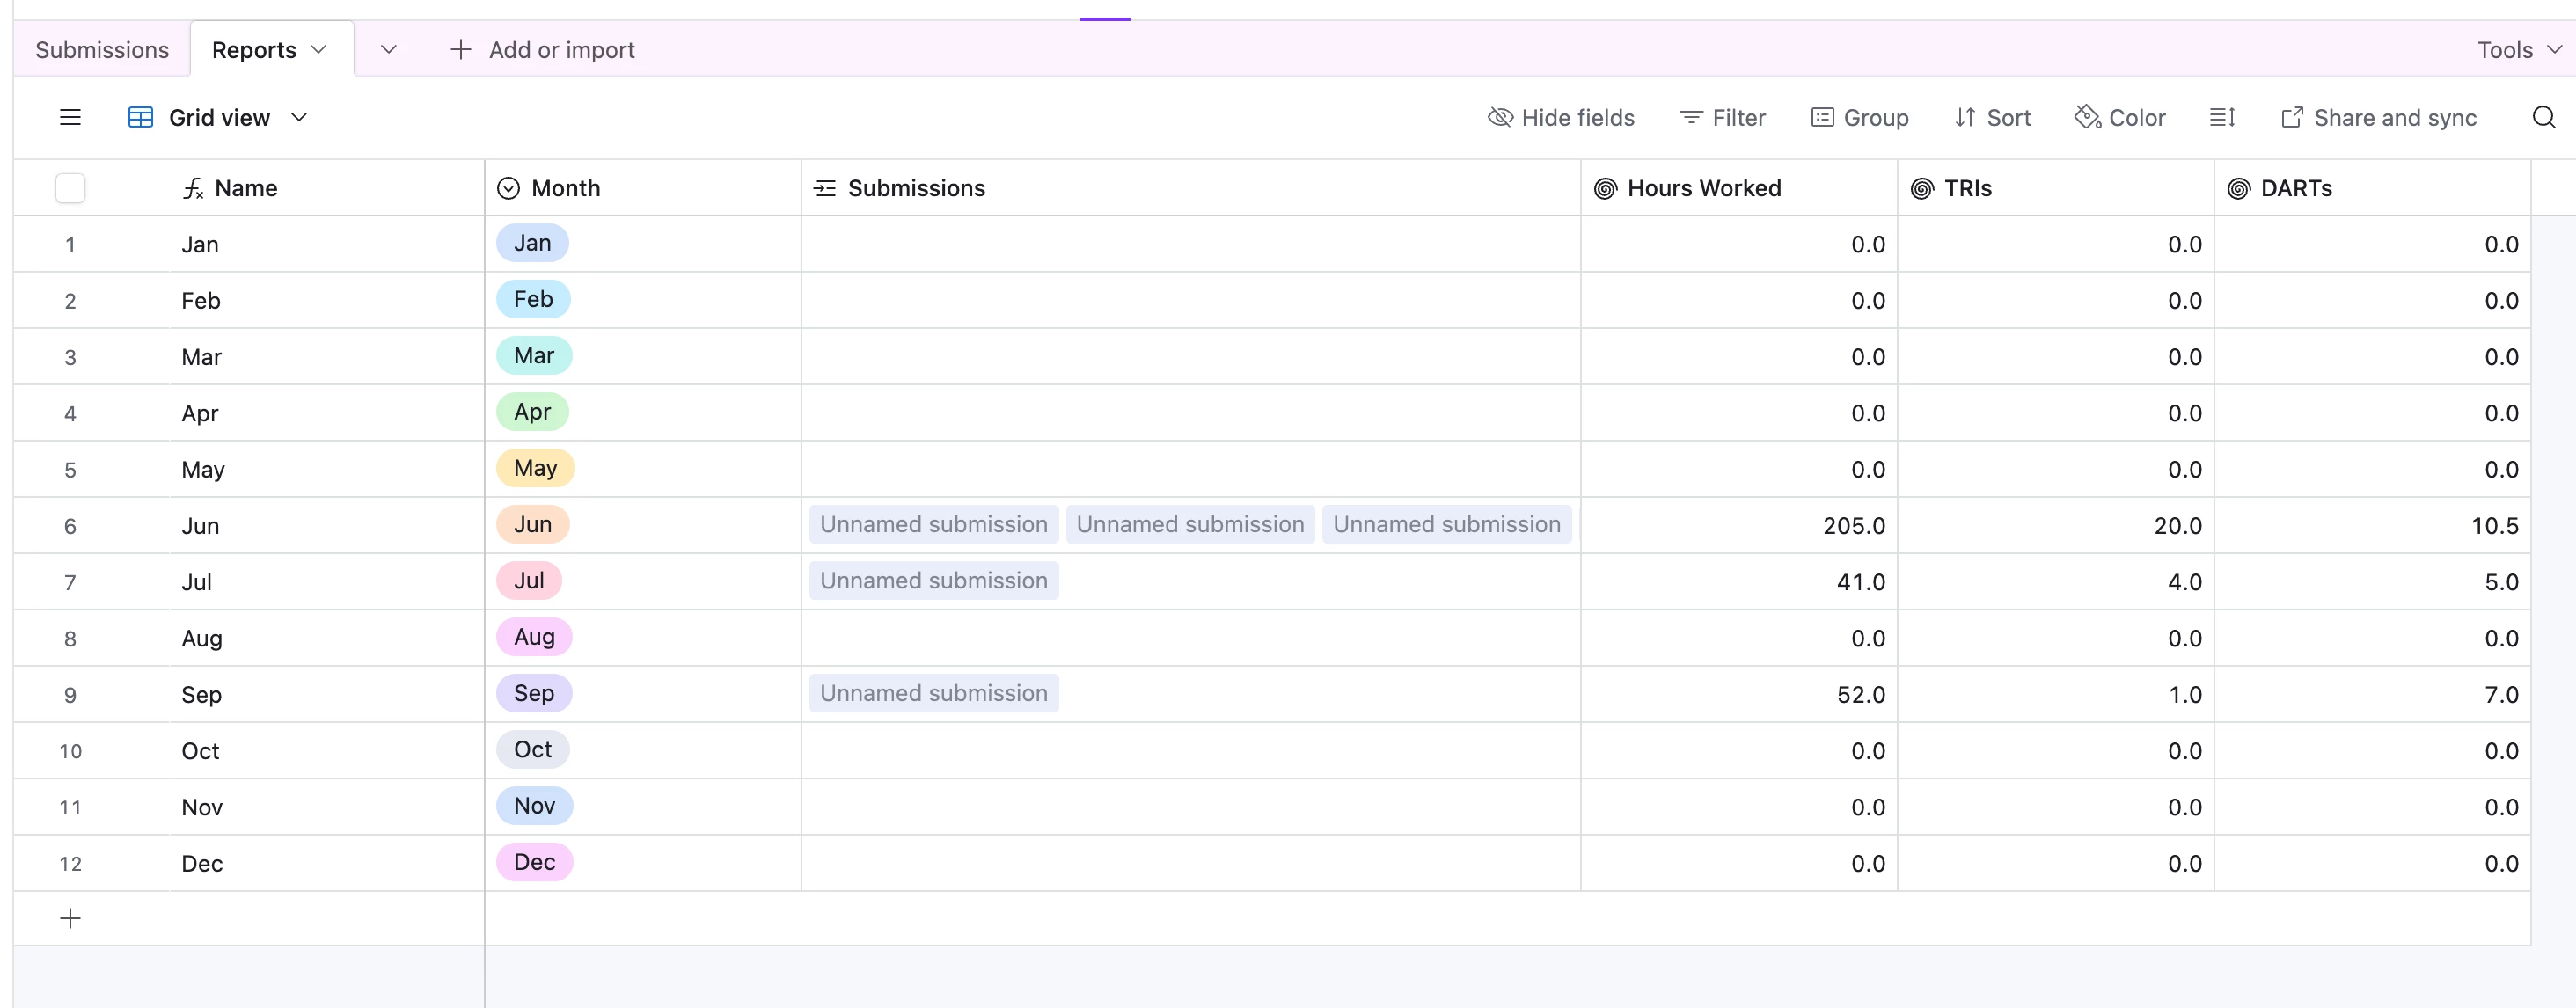
My issue is generating that TRIs and DARTs. I can easily filter off this table on July 2025 and quickly see we had 15 TRIs and 6 DARTs and the 6 million + hours . Image 3 below. I need to use those 3 filtered values to generate the monthly rate. That is where I am frozen. I SEE the values from the filtering in the GUI but can’t seem to find a way to access them for an equation.
NOTE: I thought I had it beat by simply running the equation for rates on each individual line item and then when filtering it would show me the rates via a sum. That doesn’t fly and gets wacked numbers. It has to be done on a sum of values and not running the equation on each line and summing.
The pie in the sky is to recreate the last image below, which is a running monthly table showing the TRIs, DARTs, Man Hours and their rates. That is the end goal of this!
Hopefully this adds some clarity to the issue. I could export this into PowerBI and use a more robust visualization tool to get the result but I feel like this is something AirTable should be able to do and that I am just not their technically. @TheTimeSavingCo Your idea of a rollup for each month as an option but it would be super sloppy over a number of months/years.
Thanks to the both of your for taking interest in the project! - Jon
Hey @Jon_Eynon,
Would you like to hop on a very quick call and go through it together? You can grab a slot using this link. Whatever issue you are having I’m sure we can find a solution or workaround.
It might be just me, but I am still having a hard time following through. Sorry!
With reference to your pie in the sky image, the one field per month thing might be the only way to handle it if you want the data accessible programatically I’m afraid (e.g. want to send it out via an email or something). Might be worth spending 15 minutes to make the fields for the next 10 years or something you know what I mean?
If you don’t need that kind of thing, I’m curious whether you’ve tried using a Pivot Table element on your data? Feels like that might work
---
If neither of the above options work, you’re left with the one record per month year per reporting group solution I’m afraid
@Mike_AutomaticN I signed up for a slot on Tuesday. Thanks for helping me out!
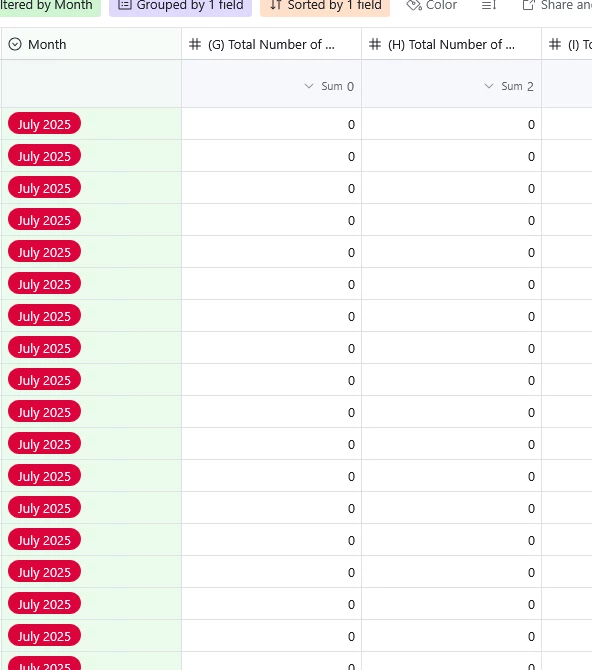
As discussed on today’s call, I would highly recommend you have a Reporting table (similar to what you intended with the Calcs table) but where each record would be a specific month. As you link your submissions (automatically ideally) to your Report records, you can have rollups to show the Sum() of the Hours, TIRs, and DARTs.
Screenshot below should help! For last, you can create interfaces to visualize this data in different ways.
If our call helped, and the above makes sense, please make sure to mark this answer as the correct solution :D
@Mike_AutomaticN In trying to do the work I have my month in the parent table. When i go and make the Report table, how did you get the
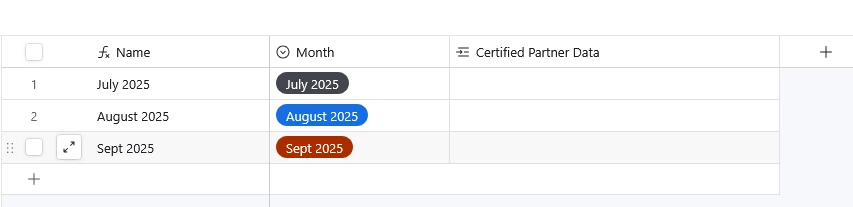
When I make my report table (below)…. How am I getting the linked records to understand I want only the month in that row? I am missing a step in the parent form I have a feeling!
@Mike_AutomaticN I figured it out! Thanks for your help. Everyone, Mike is the best and very generous with his time!
@Mike_AutomaticN I figured it out! Thanks for your help. Everyone, Mike is the best and very generous with his time!