
Hey Airtable Community! I'm ​@Ayesha_Bose from the Product team, and excited to share some small updates we’ve made to the Dashboard Layout in Interfaces recently over the last few weeks.

These are some quick changes to help you build better dashboards and make it easier for you to use.

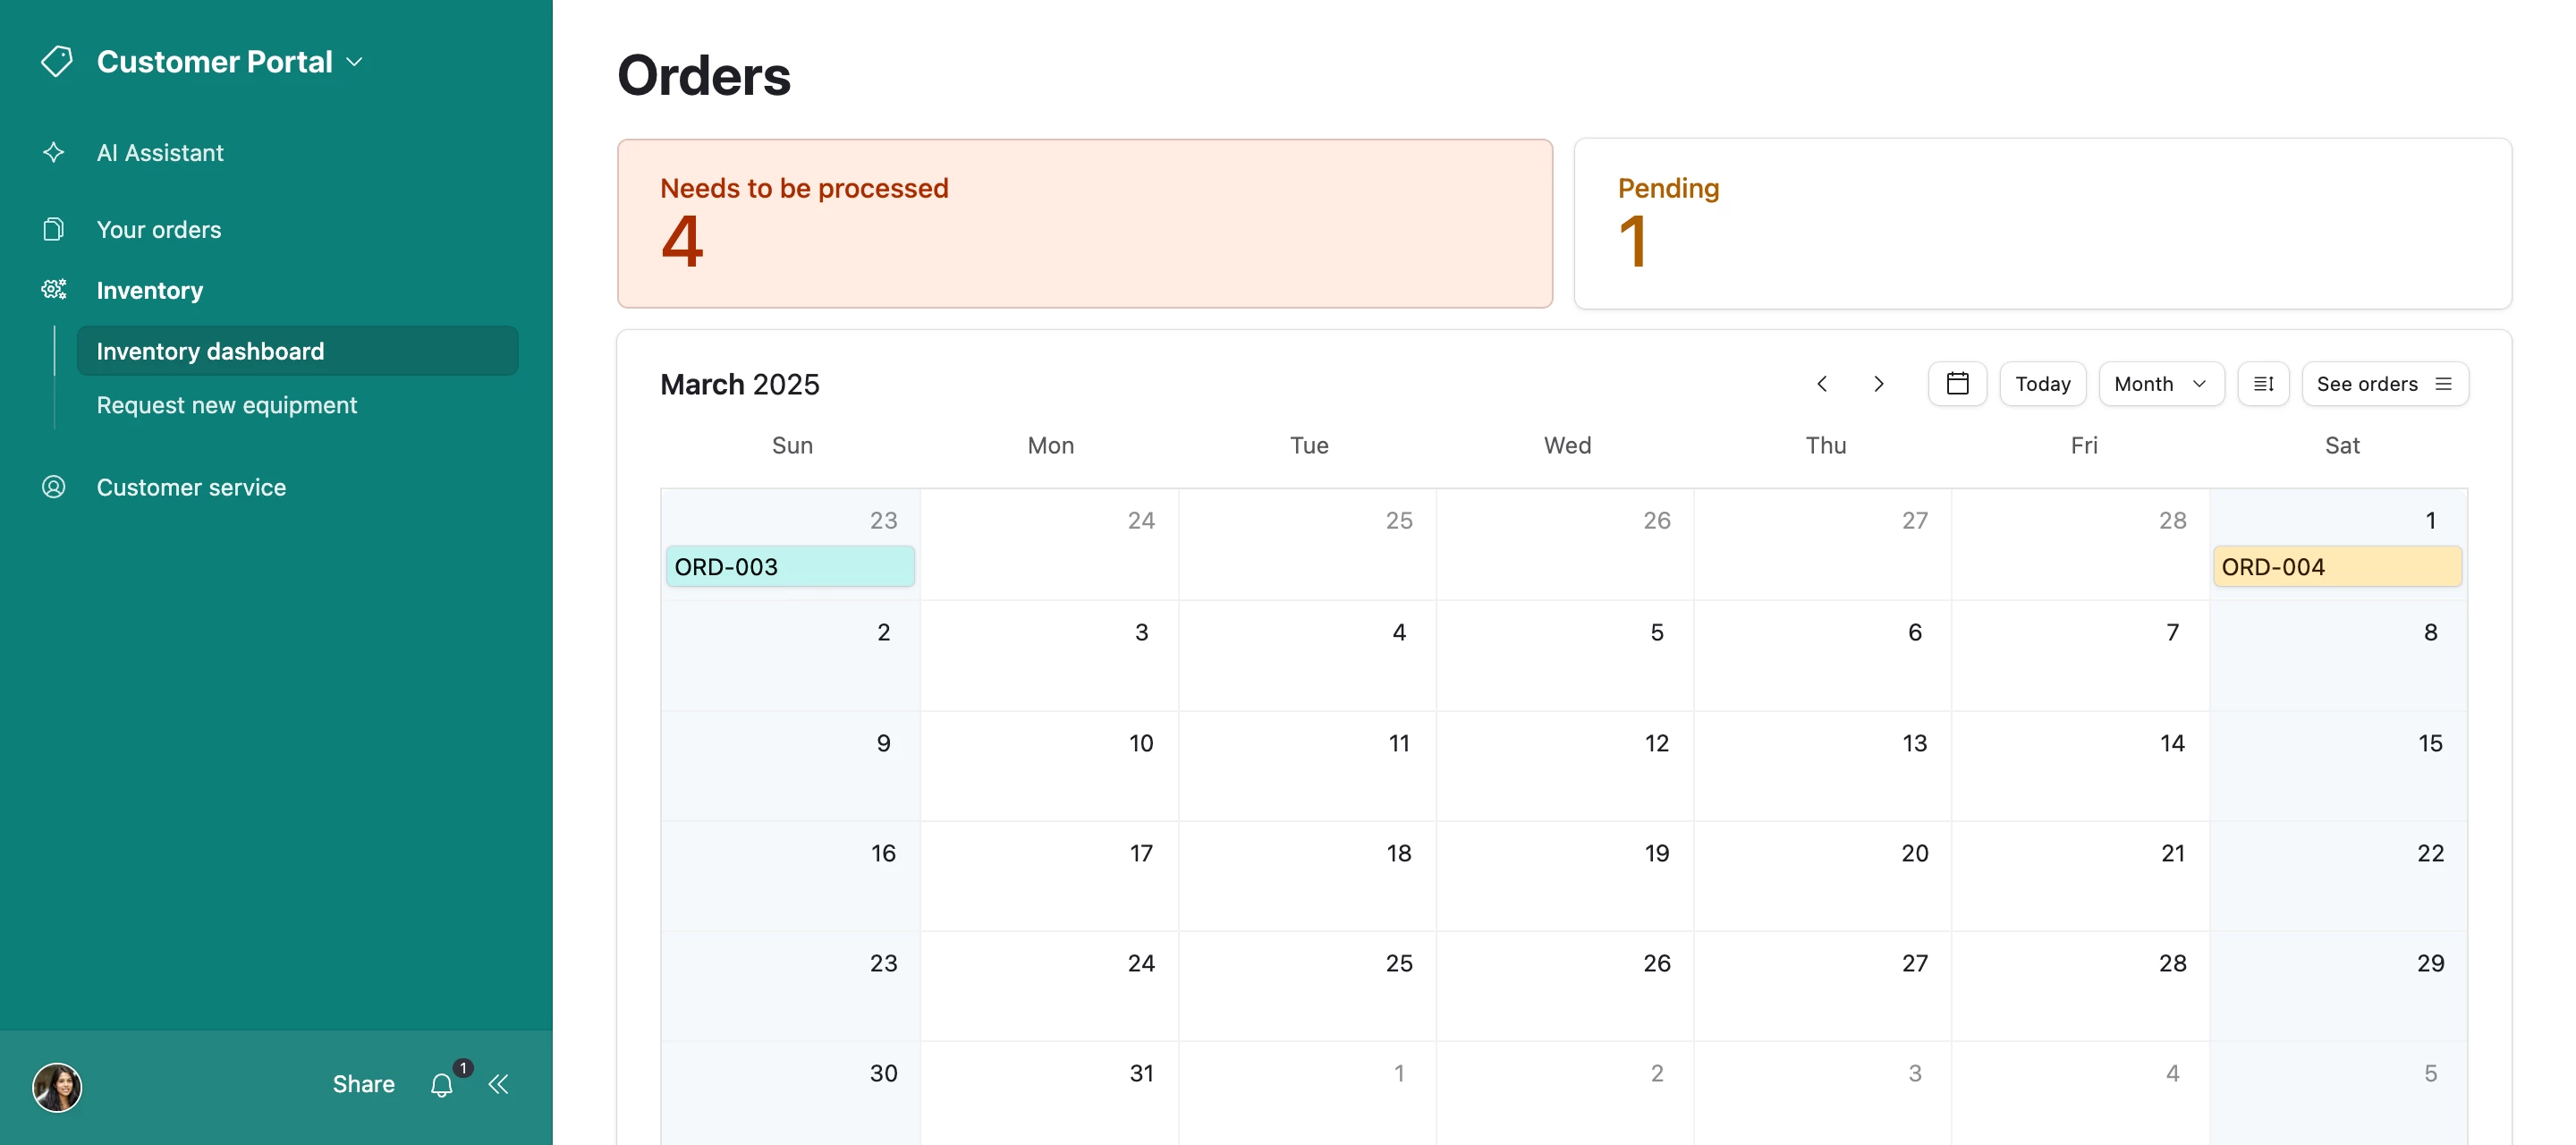
  • You can now add, delete, and edit records directly in Dashboards! For example, if you have a List view in your Dashboard, you can give your users the ability to directly edit those records.
  • We now support the Calendar view.
  • We now support the Kanban view.

AD_4nXc2g8Wk7rc1lW4MSLgh6bRfH5COg5n08dCaXsHYRd2-z1XNh6h1z9LZOAwHnSmc7q0YplFUCtB2CbRRHHLob2IkKX2zPySlaH-VWizPWcjsdKau8k-HfDs0fJri41wcWMPx2qT1?key=75sntu_tpcMR-jGkPS0XGyBU


We’d love to hear what you think about these improvements or if there’s any other areas of the dashboard layout you’d like to see improved.

We’ve got more core improvements coming very soon, including one of our top requests from the Community next week — stay tuned! 🍿🌑😎


Its very useful to edit records directly from the dashboard view.

Since dashboards are no longer “read only” I would like to see more button actions be available such as “export CSV” or “import csv”.

It would also be useful to trigger automations from the dashboard as well. Since the current “button is clicked” automation trigger expects a single record, perhaps it could be modified to accomodate an array of record ids.

Additionally, its great that Pivot Tables are available for dashboards, but they would also be useful on Detail Pages/Record Review.


Oh, this is huge! Thanks for sharing ​@Ayesha_Bose!

Would be super nice to have flexibility:
- Elements cannot be freely organized within a group currently, but can only follow a very specific order (e.g. Numbers above Charts, and so on)
- Groups cannot include elements with different sources (e.g. each group can only have 1 source, but we cannot have a group with a Number element from Contacts table and a chart from Interactions table for example).


- Groups cannot include elements with different sources (e.g. each group can only have 1 source, but we cannot have a group with a Number element from Contacts table and a chart from Interactions table for example).

We used to be able to do this, but I think they changed it to ensure greater consistency across printers. Would be great to get it back!


these are good, but i still need:


  1. Ability to open a sidesheet with button click (instead of open in new tab), so that we can have more expanded context/data for editing hidden but quickly accessible
  2. Ability to export pivot table data as CSV, not just print to PDF
  3. Ability to change barchart/pivot table “bucket by” dates on the fly instead of editing the interface.
  4. Ability to add static text/images
  5. Ability to add grids (not just lists)

A lot of functionality is in the old legacy “blank” interface page elements, but if we use that we lose all the newer features like ability to see history/chat easily, and some other QOL improvements. 


And for a real gamechanger, would LOVE the ability to have filters apply to all pages/groups where applicable. For example, if i have a field “Release Year”, and it is a lookup field on all tables, then if i do a dashboard with a few different data summaries from each table with a single filter at top of dashboard, the “Release Year” should be a universal filter that is available to apply to ALL data groups, and not need to add as an individual filter to each data group. Does that make sense?


Additionally, its great that Pivot Tables are available for dashboards, but they would also be useful on Detail Pages/Record Review.


Along similar line of thought, why cant we add a barchart to the top of a list view interface? or a number and barchart on top of a kanban/timeline interfaces? These elements should be applicable anywhere instead of making it so limited for workflows.


Reply