Hey community. I'm putting together a new CRM, and I'm wondering if it's possible to send chart elements (graphs) in a slack message or email on a regular weekly cadence. Any thoughts or insights appreciated!

Solved
Send interface elements
 +1
+1Best answer by Ben_Young1
Hey @ghushek!
At this time, it is not possible to send graphs or other Interface elements in any automations.
Additionally, Airtable has not publicly indicated that this feature lives anywhere on their release roadmap.
Now, there is an interesting workaround that you can experiment with, but it's entirely dependent on your available resources or your comfort with JavaScript, JSON, and the Airtable scripting environment (depending on how dynamic you want these charts to be.)
There's a very compelling, open-source tool called QuickChart that will create a rendered chart graphic based on either JSON passed in the query parameters of a GET request or the body of a POST request depending on the complexity of your data.
For example, if I want a graph to report on the number of records in a set of tables, I would encode the following dataset to the URL:
{
    type: "bar",
    data: {
        labels: ["Table 1", "Table 2", "Table 3", "Table 4", "Table 5"],
        datasets: [{
            label: "Record Count",
            data: [120, 60, 50, 180, 120]
        }]
    }
}
Here's the URL:
https://quickchart.io/chart?c={type:%27bar%27,data:{labels:[%27Table%201%27,%27Table%202%27,%27Table%203%27,%27Table%204%27,%27Table%205%27],datasets:[{label:%27Record%20Count%27,data:[120,60,50,180,120]}]}}&backgroundColor=whiteIf you navigate to that URL in your browser, it will simply return a PNG of the graph.
Then, you can simply pass that link into your Slack or email automation like so:
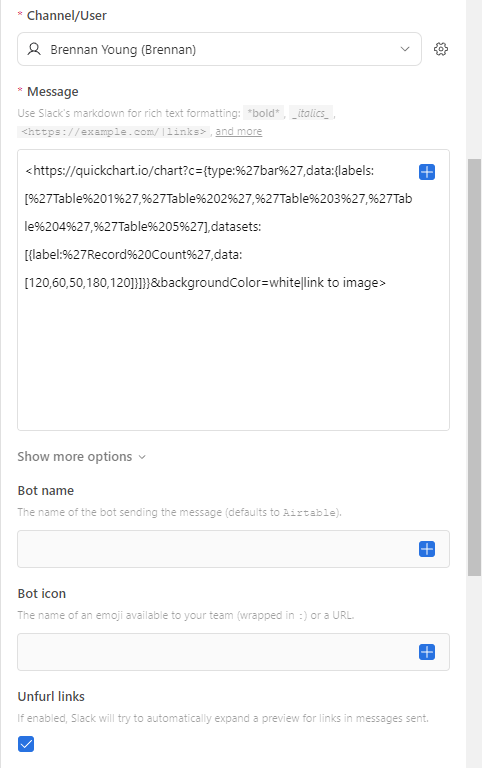
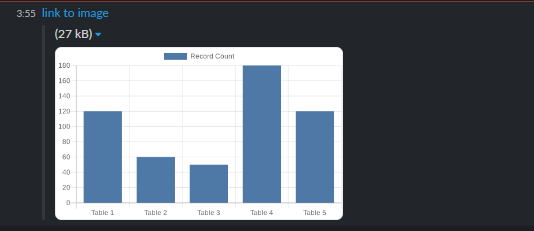
And here's the end result in Slack:
Worth mentioning that QuickChart also has support for building charts directly from your Airtable data. The documentation can be found here.
This topic has been closed for replies.


Enter your E-mail address. We'll send you an e-mail with instructions to reset your password.