Hello,
First of all, I apologize if I have duplicated this topic, but I couldn’t find the right answer.
I’m trying to determine the best practice for organizing data and reporting for a workflow that I believe many others are dealing with.
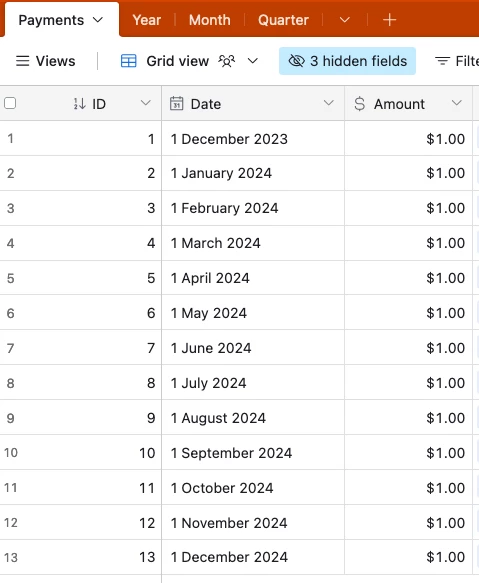
I have a table called PAYMENTS, where we store all payments our company has made. We also have a RECURRING PAYMENTS table, where we track recurring payments that are automatically added to the PAYMENTS table based on the period set up.
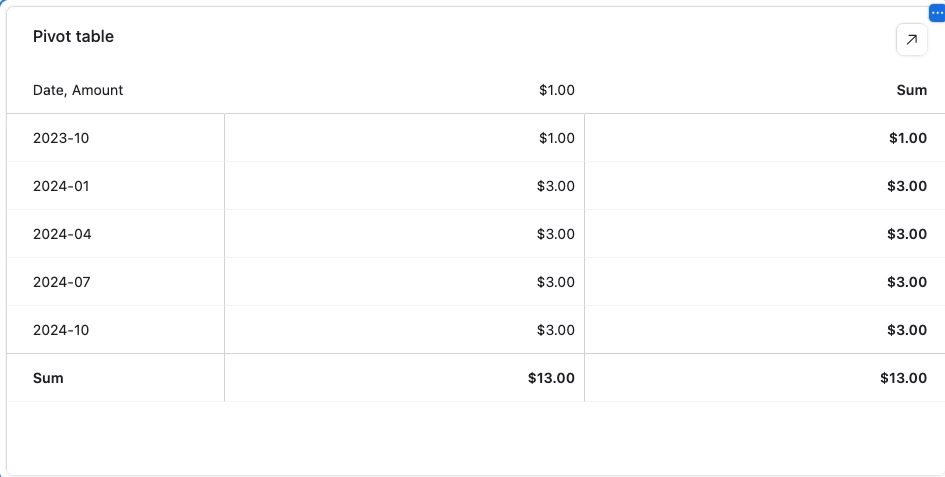
However, we are struggling with reporting our payments for specific periods, such as a year, month, or quarter. Is there any way to solve this using only the Date field? I’ve tried creating a pivot table to sort payments by months for current year and categories.
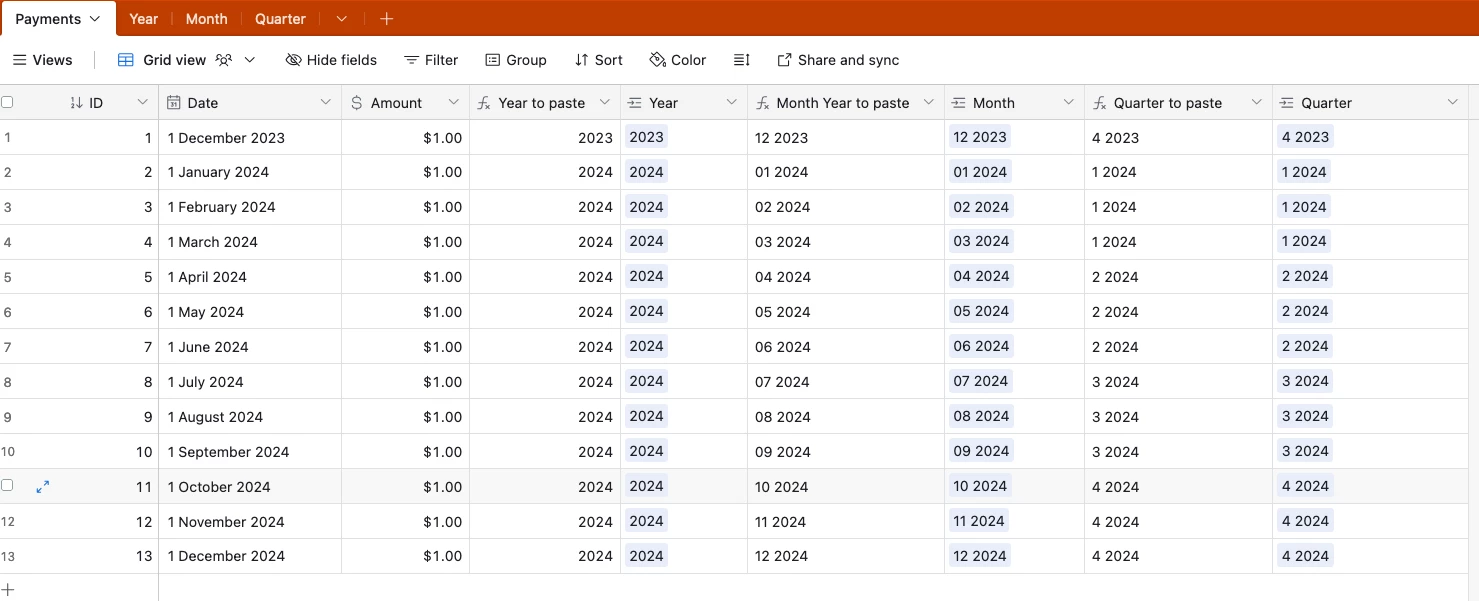
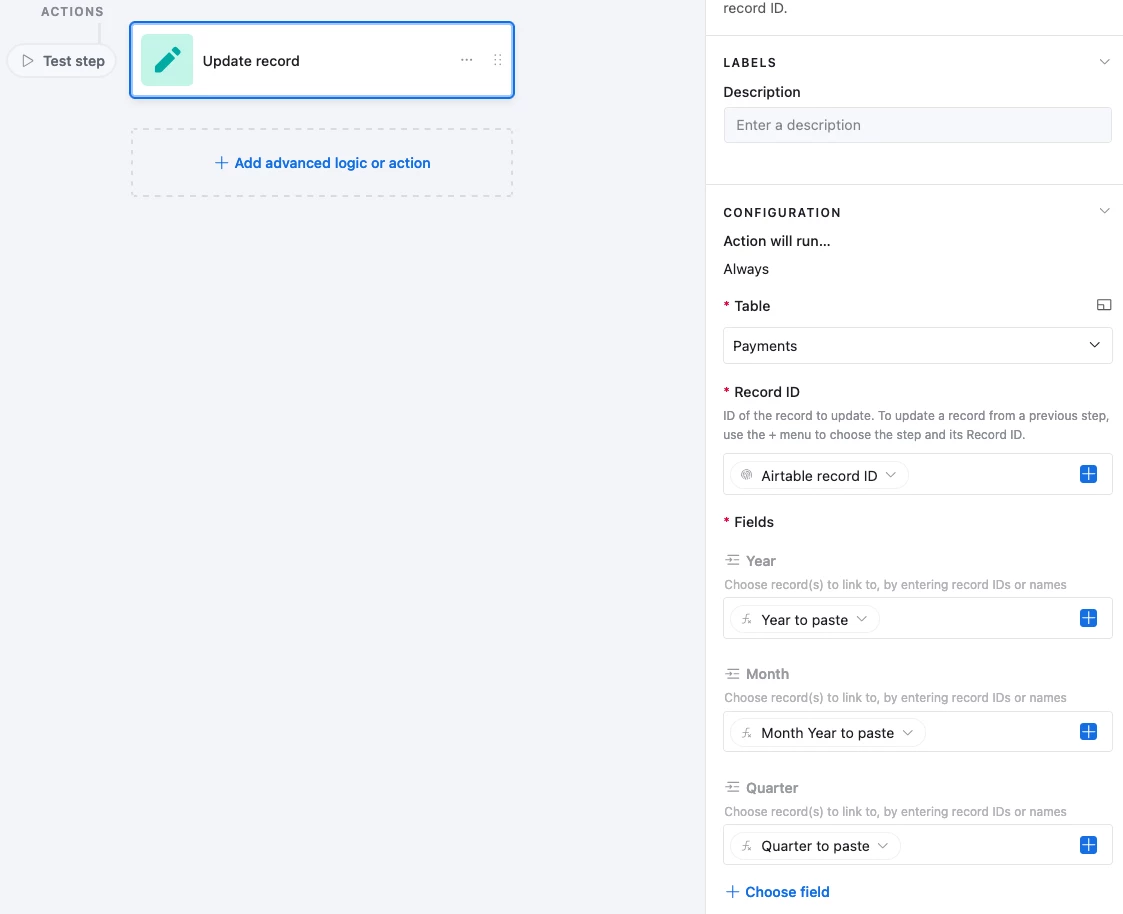
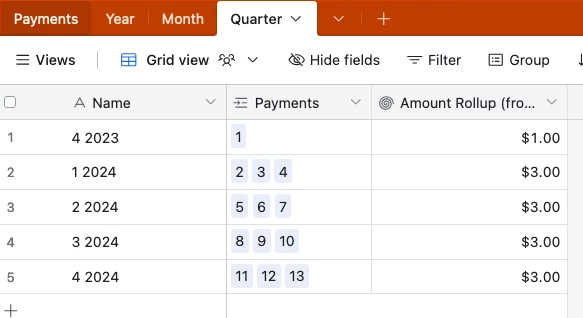
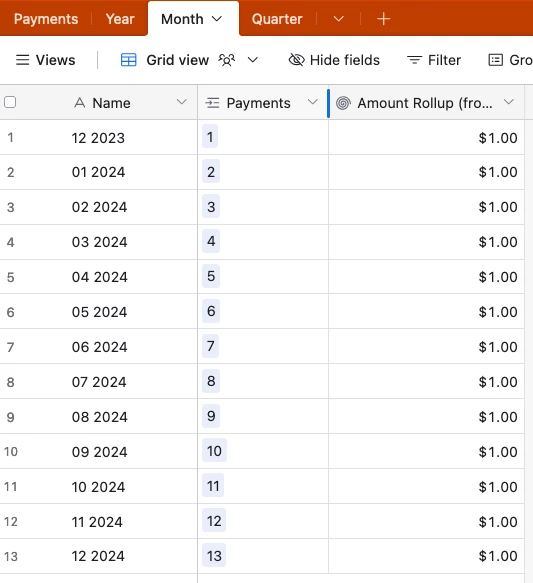
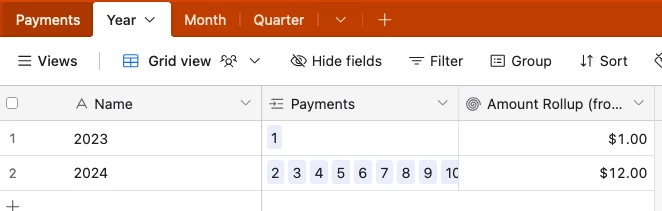
So far, I’ve created separate tables for Year, Month, and Quarter, each linked to the PAYMENTS table. Payments are then associated with a specific period. I believe some automation could assign these periods based on the Date field.
This workflow also works when trying to predict what income or expenses to expect in specific months because I have linked the Month field in the RECURRING PAYMENTS table.
Or should we create a top-level table where automation creates a new record for each month and links it to specific Year, Month, and Quarter? This way, each record would represent a month, allowing me to group them by Quarter and Year and collect all payments using a Rollup field. Then, all reports would draw exclusively from this table.
However, I’m not sure if there’s a better way to handle this. I would really appreciate any suggestions.
Thank you!