
Hi all, 

I’m having a hard time finding an answer to something that seems like it should be easy, but I can’t quite figure it out and other examples don’t fit my use case very nicely. I tried making sense of dynamic filters, but it wasn’t doing what I needed it to. 

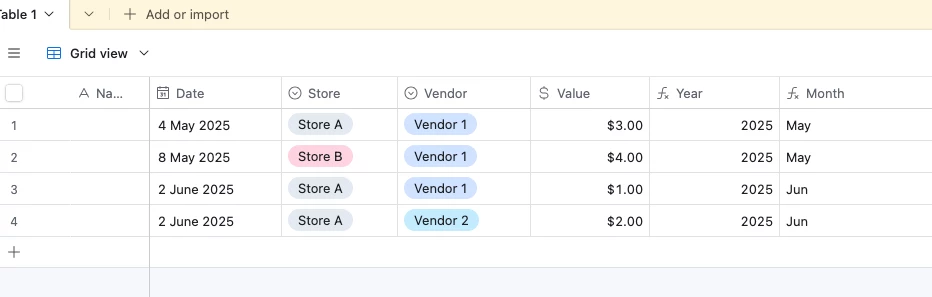
I’m working on an advertising sheet across multiple vendors, categories, months, and stores. In essence, we have one tab in our sheet where all of our bills get dumped. It has the vendor name, amount, and single-selects for month, store code, and category. 

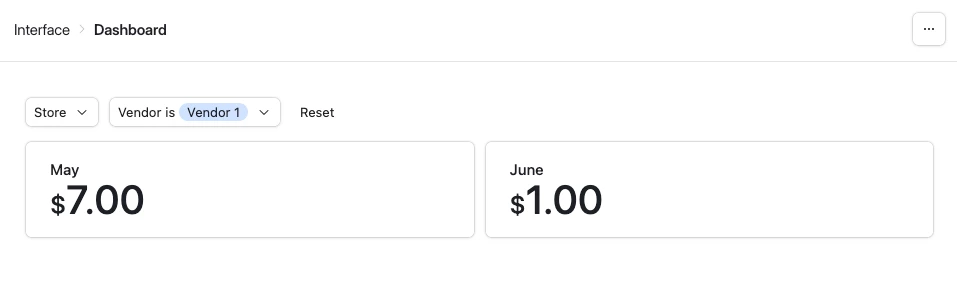
I’m creating a linked database that creates a pivot table of all of the vendors as the rows and columns for each month of the year, using rollups to calculate how much we spent with each vendor each month. Sounds simple. 

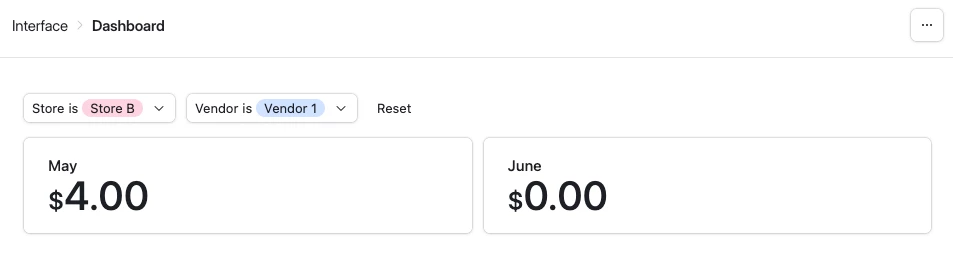
However, I’m running into issues with trying to filter the table by store. Many stores utilize the same vendors, so when I try to filter by store code, it’s totaling all of the bills per month for each vendor that the store code I selected utilizes. The issue is that it isn’t filtering out for only the bills for that particular store. It’s totaling ALL of the bills for each vendor that the selected store uses, even bills for other stores. Here is a screenshot for reference: 


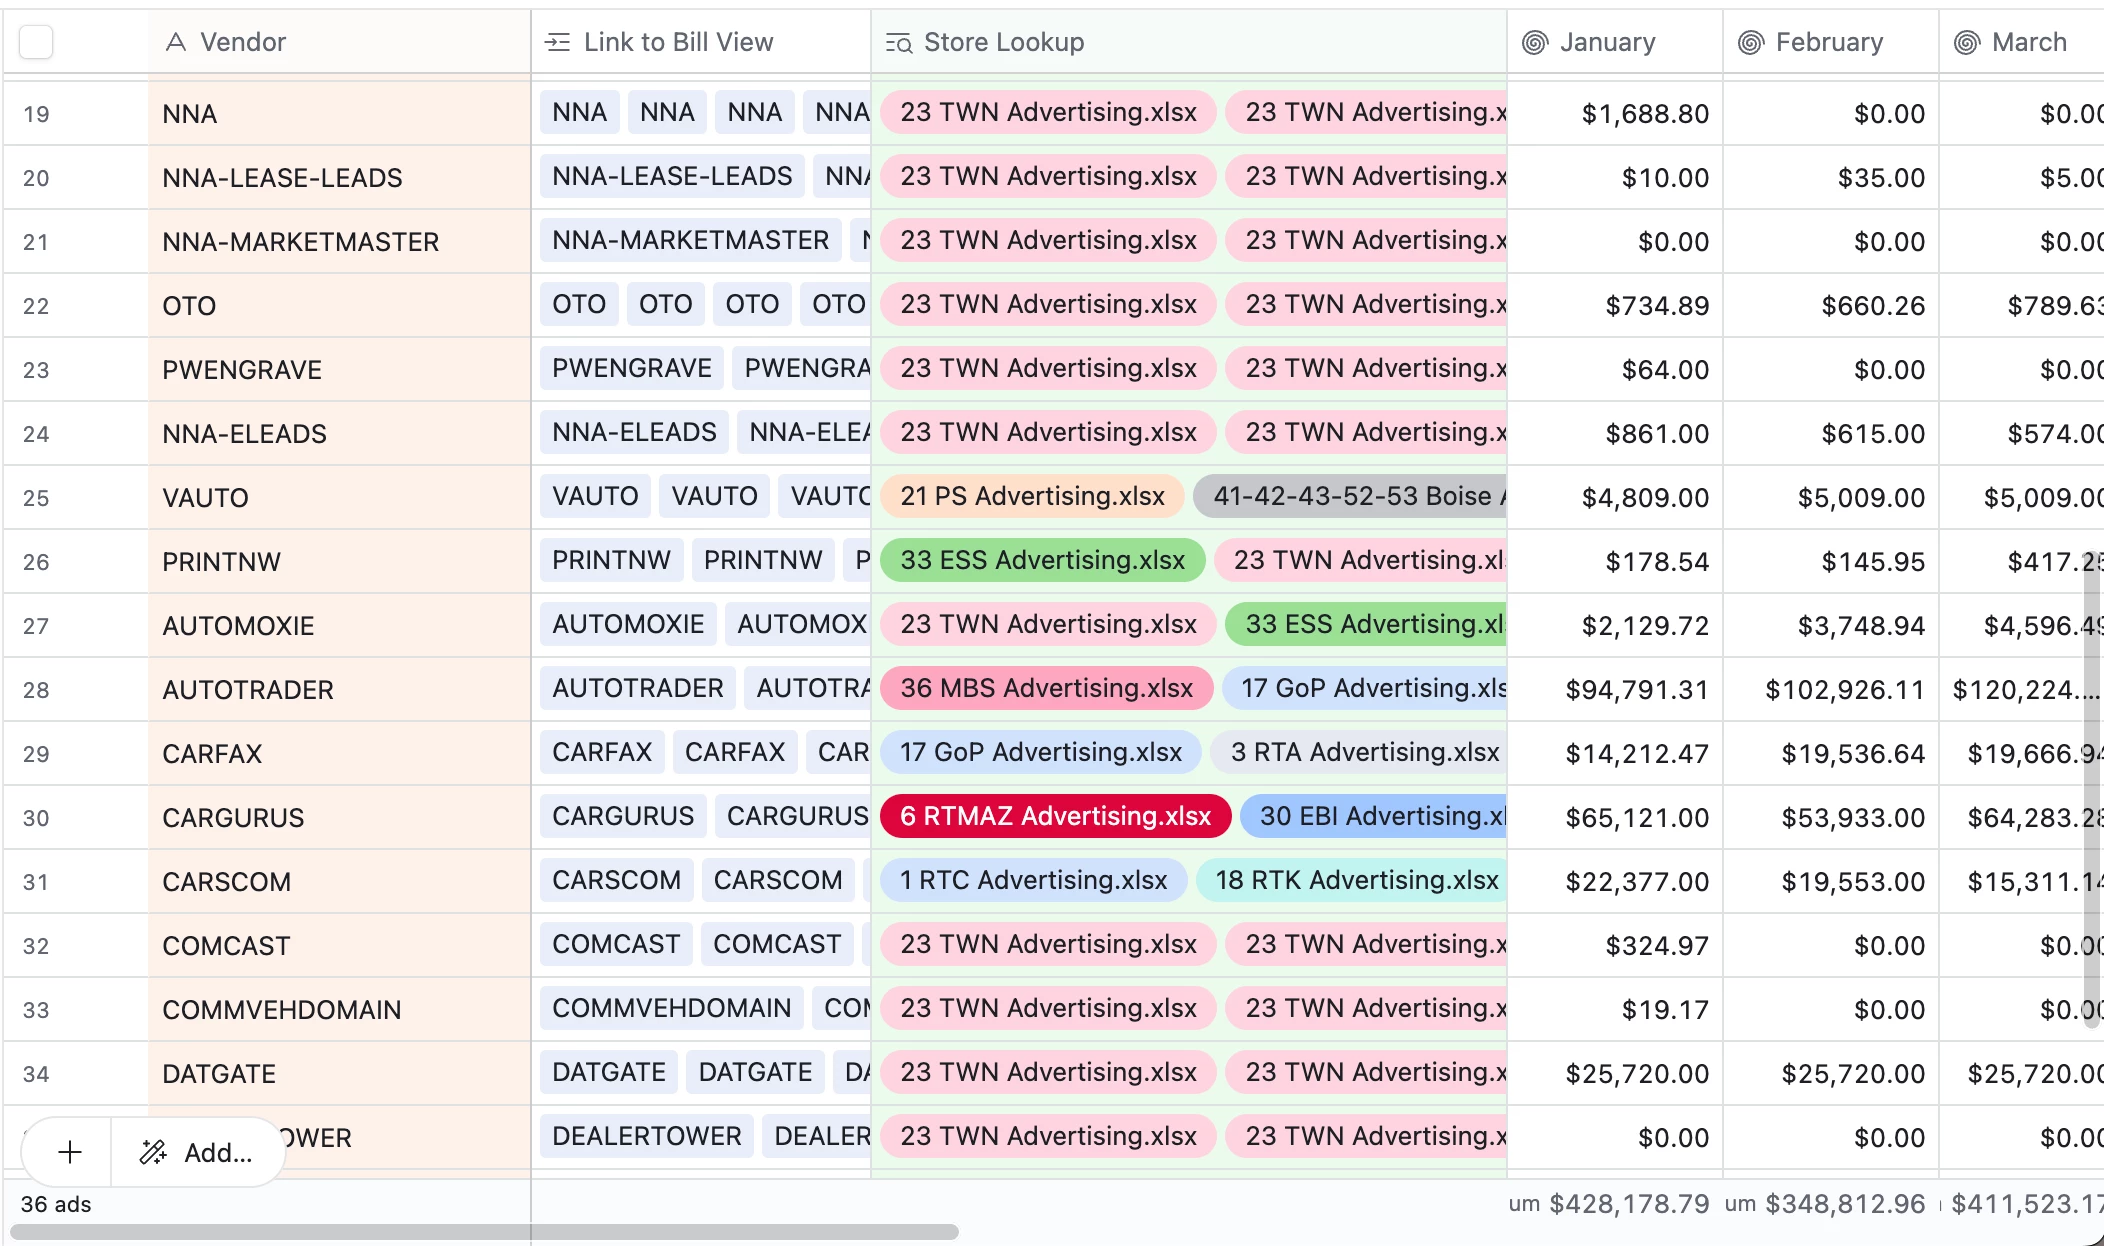
This is after applying a filter for store code “23 TWN Advertising.xlsx”. As you can see, it’s grabbing every vendor that that store uses and totalling all bills for that vendor, so for vendors that have bills for multiple stores, I’m getting inaccurate numbers. 

Any ideas on how I can better create this to make the data more easily filterable by store? It’d be nice to still be able to remove the filter and see our spend by vendor. Dynamic filtering doesn’t seem to be helping me. Perhaps I’m just not understanding how to use it. 

Ah yeah, with that set up you’re going to need to update each rollup field’s filter conditional filter every time you want to check on a different store, which isn’t tenable

A possible workaround is for you to use an Interface instead?  I’ve set it up here for you to check out and provided screenshots of how that’d look below. 

Alternatively, if you need to be able to handle that data programatically (e.g. want to send it out as a report or something), you could try to set up a new table where each record represents a single Store <> Vendor <> Month link


Maybe there is someway to use an interface. What you sent won’t work exactly, but perhaps exploring interfaces could unlock something. I’d need to be able to see all vendors in a list at the left and all months along the top, not one vendor at a time. We basically need a health report for each store. I’d rather not have a separate tab for each store, since we have close to 50 locations, but it’s seeming like something like that may be our only option. I tried to set it up as views within a single table, but changing the column rollup condition in one view changes it for all the others, unfortunately. Frustrating to feel so close, but not be able to achieve what we need! 


Hmm yeah, do you think a pivot table might be able to do what you need?  
---

In my head, you want to see all Vendors, the list of Stores for each Vendor, and the monthly breakdown for each store, with the months as columns, as well as the overall for the Vendor, is that right?

Could you provide a screenshot of some of your example data, as well as a mockup of what you would want the final thing to look like?  If you could create some example data and DM me a link to it that’d be really appreciated; that way I know I can work on it directly instead of rebuilding your data structure you know what I mean?


Hi, 

The solution ‘by design’ is any kind of pivot table, able to filter input data by store, and interface came on mind first. But if for some reasons you don’t want interface, there is a workaround. You can use it, or see and decide that  interface is easier. But to be honest, it’s very easy, but not very clean. To avoid any scripting/automation, especially, if there are many thousands in Bill table, the only good way to quick switch is lookup from small 1 record table linked to all records.  It’s like a filter element in interface.
I did such for several important base-level values. like exchange rate which affects data in several tables. also interest rate, etc


I just get random data and call any field ‘Stores’. the rest is simple. 3 last fields here can be hidden


So, the rest is to change your pivot table to show only ‘Y’
If you update Bill from time to time, set automation to put ‘filter’ when a record match condition ‘filter is empty’. the rest are computed.
You might want to add value like ‘SHOW ALL’ and change formula, adding   IF(value=’SHOW ALL’, ‘Y”

(last 3 can be hidden too)


To make single-select field in filter table (cannot be primary), copy-paste column of stores there (say yes when it asks to add 999 records). if it’s not single-select yet, turn to it. then delete all records, except first. Single-select options are field properties, they stay even if you delete all records

So, good luck with that, OR good luck if you decide to better use interfaces  :)