Hi all,
I think I'm close, but I just can't workout how to get the forecasting base I'm building to show Monthly sales vs Monthly Forecasts when I want to track them across an additional split out by stream.
I have this Monthly table linked to the projects table, but only solution I can see next is to pull in Each Stream's target as a look up field regardless if it's relevant to that project.
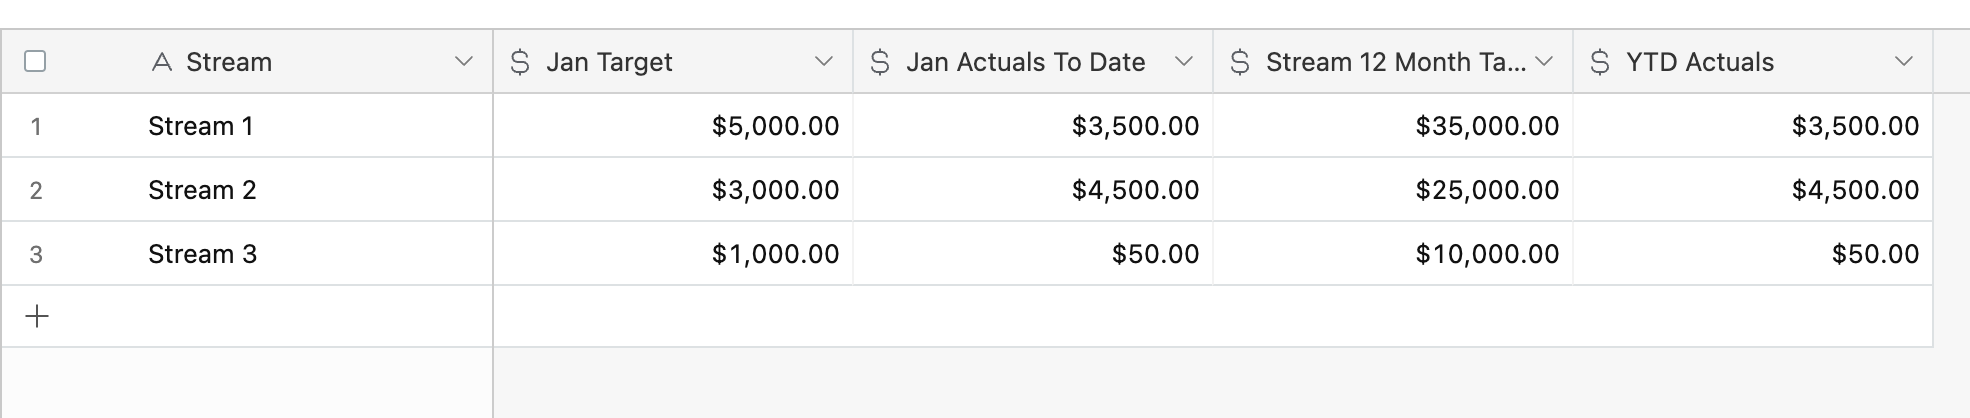
Monthly Forecasting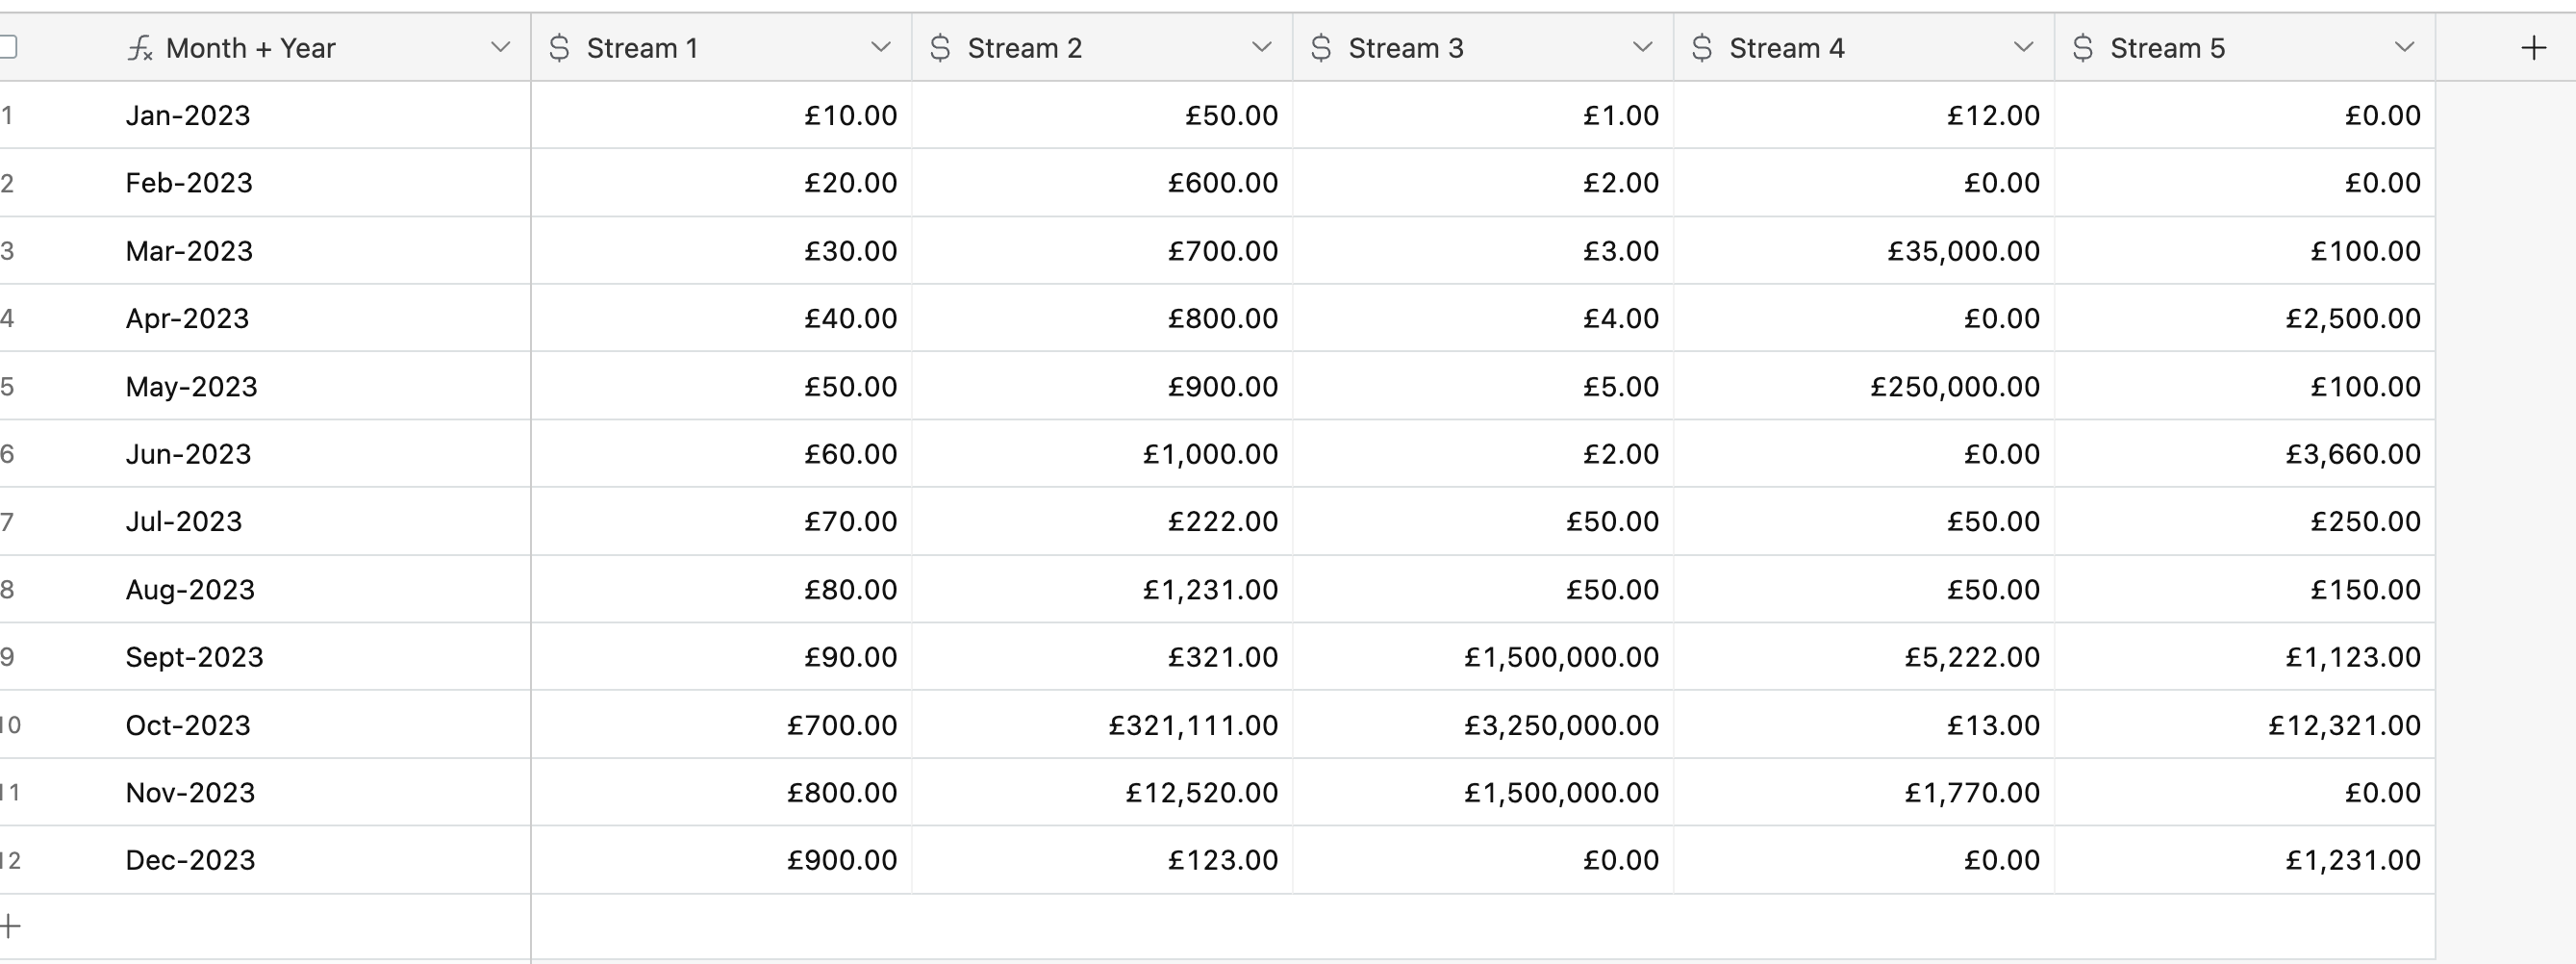
Project Table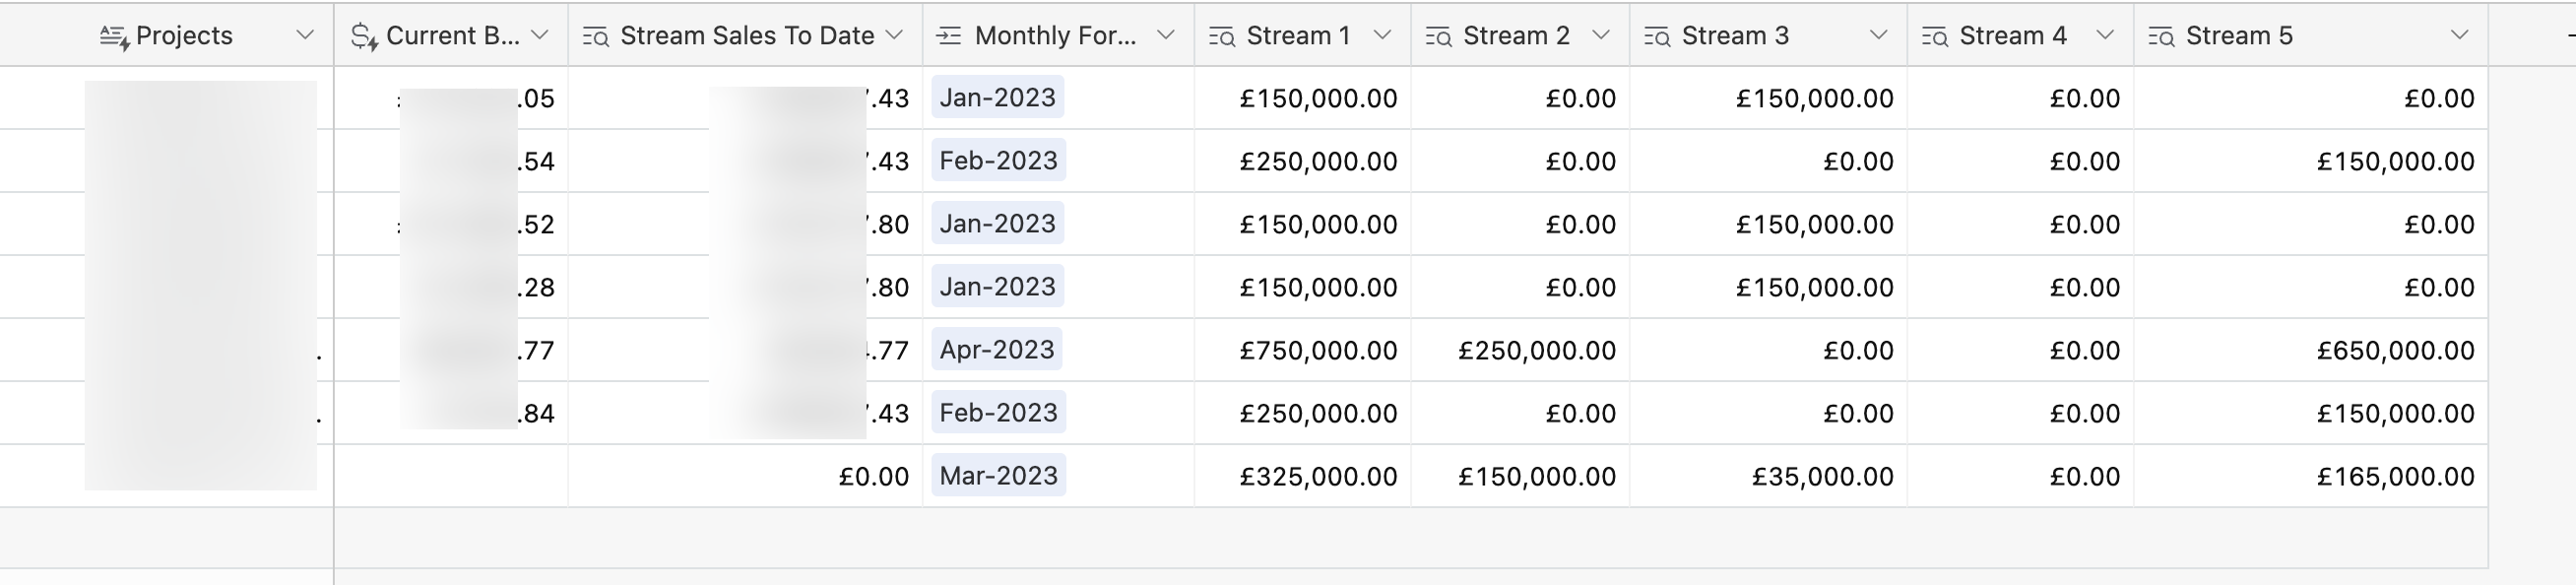
I'm also trying to see if I can get it to work visually instead using the Chart Extension, so any advice there also welcome.
And please - if this isn't clear enough - do ask questions! Any help greatly appreciated!