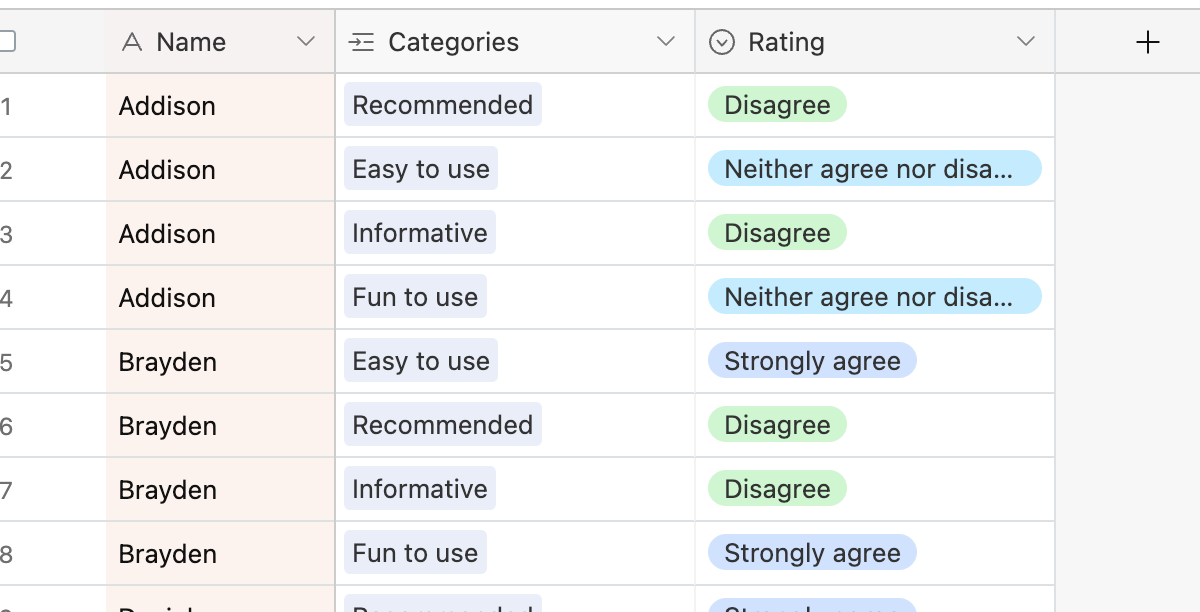
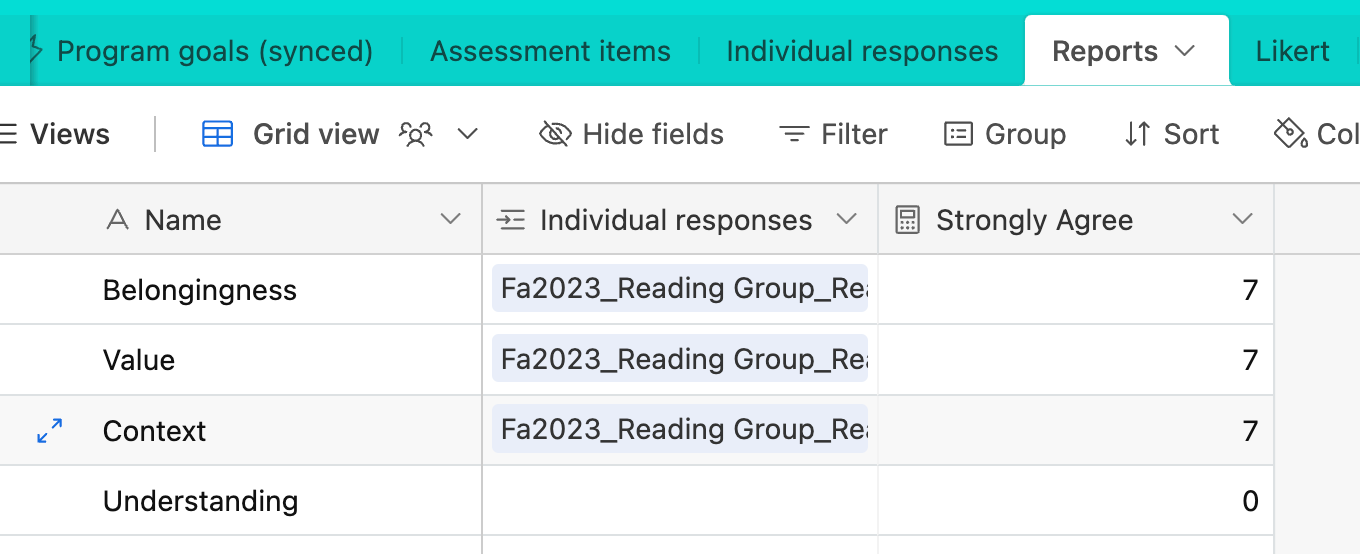
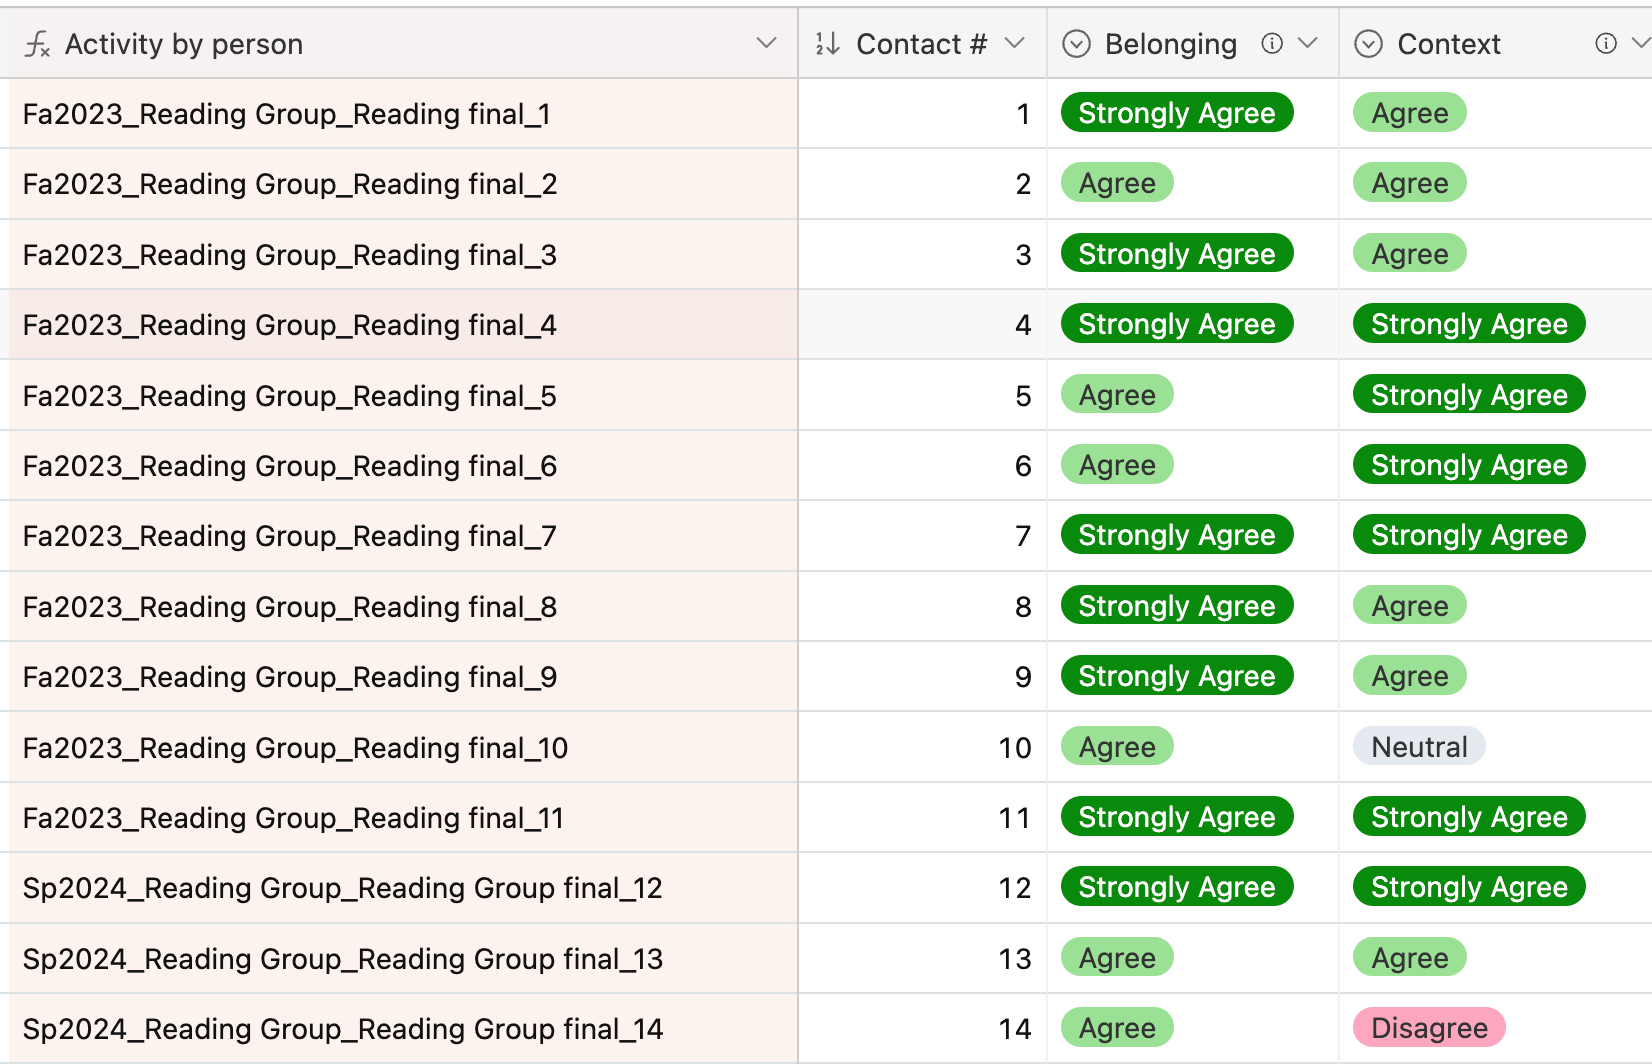
I have a base set up to log participant feedback after people attend a program. Respondents fill out a form and give ratings to questions related to different dimensions (belongingness, context, etc.); I currently have responses linked to activities and program profiles, which determine the specific dimensions that are presented in the survey.
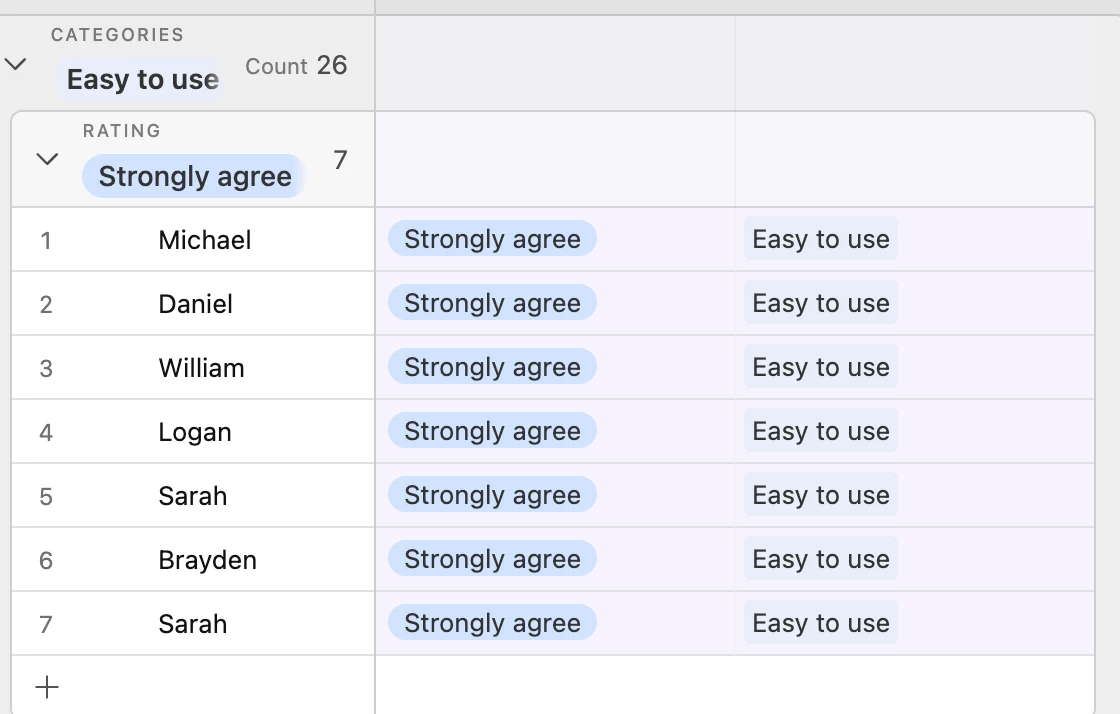
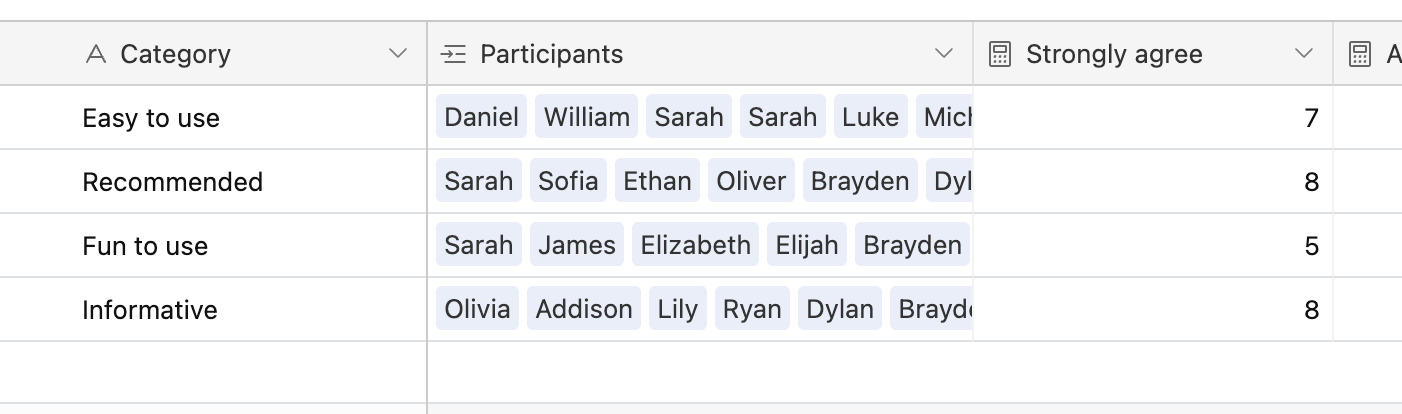
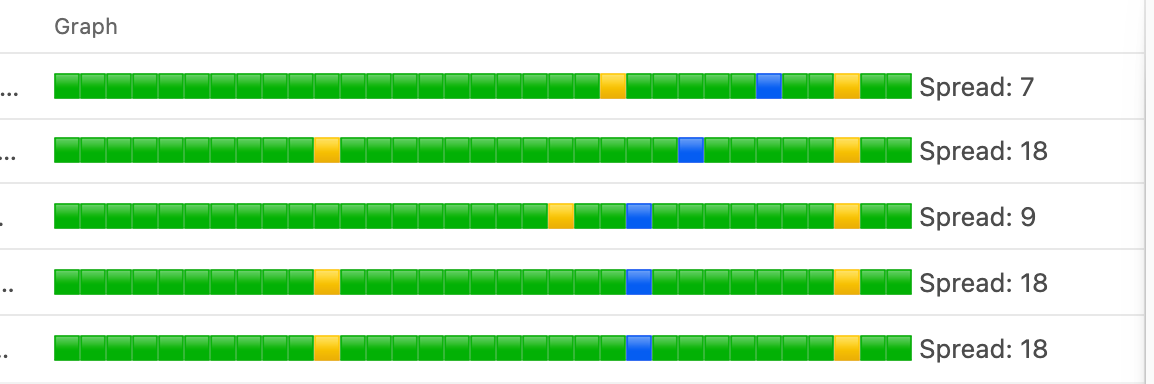
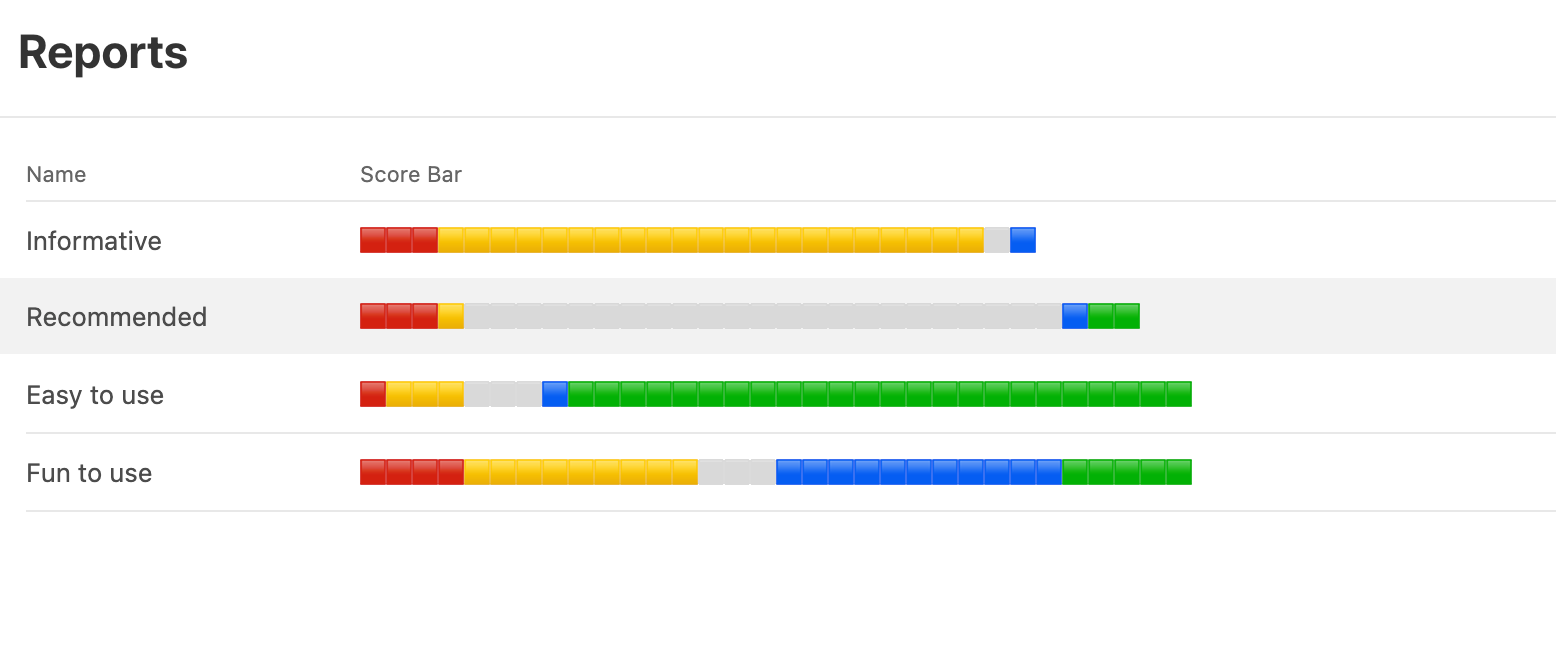
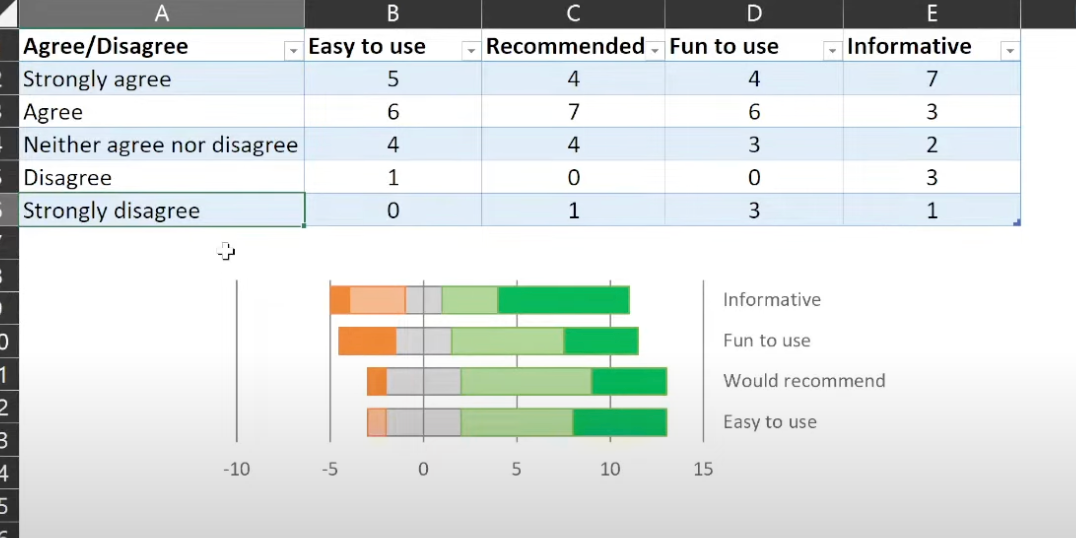
I want to make a Likert chart for each program that shows the distribution of ratings for each dimension. To do that, the response data needs to be arranged as below, where the cells are counts of the number of people giving each response for each dimension:
I've played with creating different views, experimented with rollups and formulas, but I haven't found an approach that gives me the output I need without requiring me to transcribe counts manually into the correct table format.
Any help or insight (ideally without requiring the purchase of additional extensions) is greatly appreciated!!