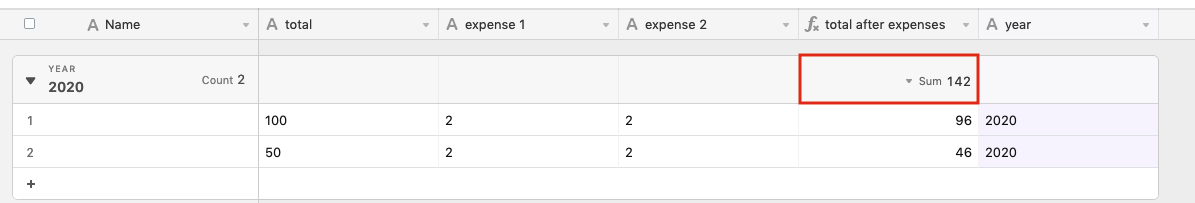
Are you saying that you’d like a table that looks something like this?
Totals Year Expense 1 Expense 2 Total after Expenses
500 2020 100 100 300
400 2020 50 50 300
-----------------------------------------------
900 600
If not, could you describe a bit more about what kind of data you’ll be working with?
Hi @Zollie
Yes. This is the setup I was was thinking about and preferably all in one table.
I just don’t know how to set up the formulas/calculations. I can set up the base myself.
Thank you,
Mary
Hi @Zollie
Yes. This is the setup I was was thinking about and preferably all in one table.
I just don’t know how to set up the formulas/calculations. I can set up the base myself.
Thank you,
Mary
Thanks Mary. So using this example:
Totals Year Expense 1 Expense 2 Total after Expenses
500 2020 100 100 300
400 2020 50 50 300
Total After Expenses
‘Total after Expenses’ has the following formula:
{Total} - SUM({Expense 1},{Expense 2})
If you want to name your columns differently, just make sure you replace the column names in the formula (‘Total’, ‘Expense 1’, 'Expense 2). If you end up needing to add more expense fields, just add the new field(s) to the SUM function like this:
{Total} - SUM({Expense 1},{Expense 2},{Expense 3})
Grouping for Sums
Then if you group the table by the year field, each group should provide a summation of all the values under that year. Like so:

If those aren’t displaying automatically see the summary documentation.