
I've created a summarization in excel that I want to replicate in airtable, I can't for the life of me figure out how to do it.

I have a production operation for large machines. Here are the main steps:

  1. I pick up inventory on Date A, at a cost of X

  2. I predict I will sell the inventory on Date B, at a revenue of Y

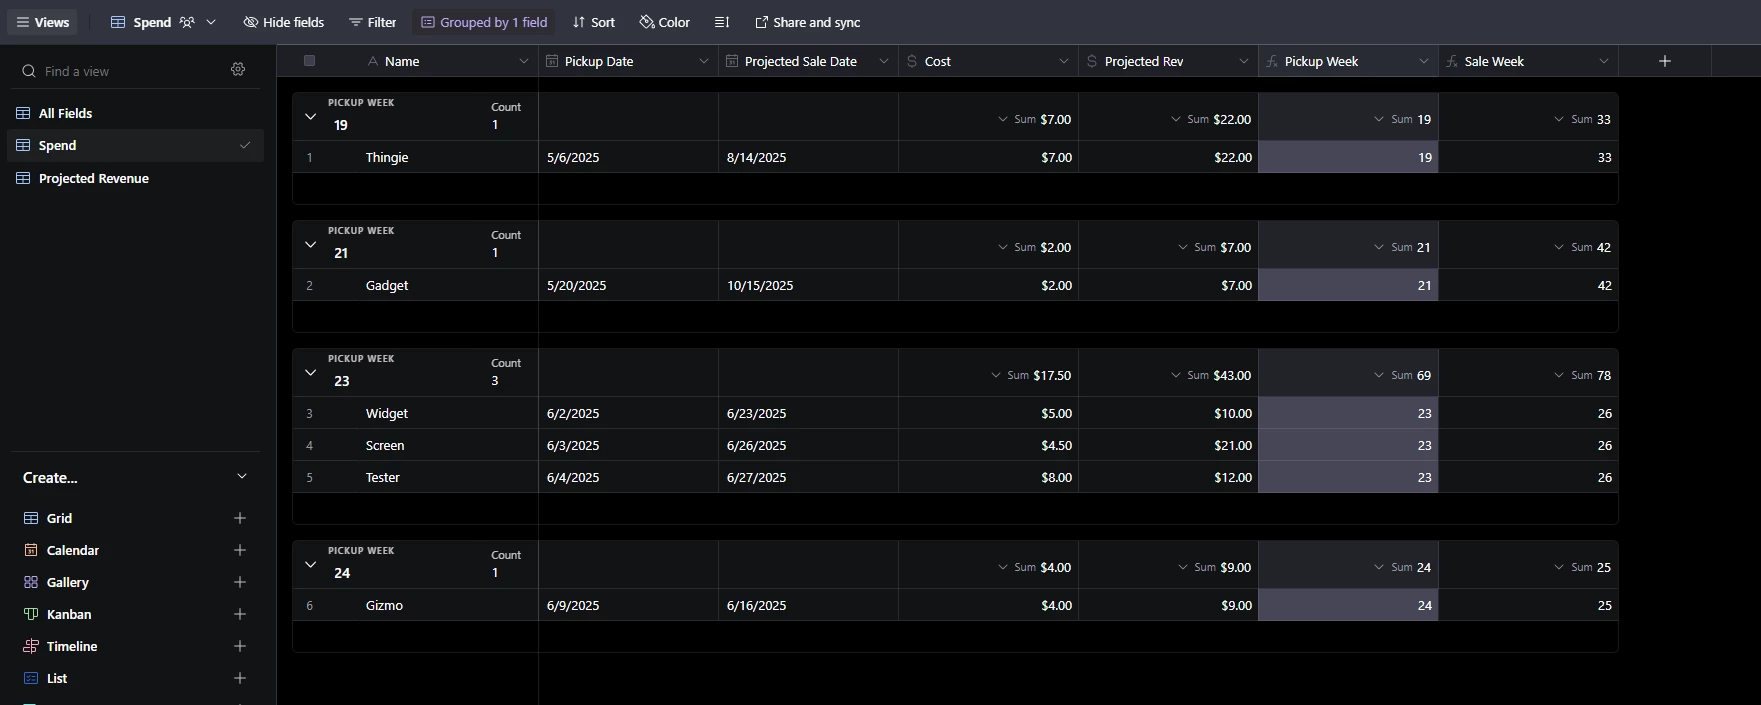
My data table is: Machine Build #, Date A, Cost X, Date B, Rev Y

I want to summarize a bunch of things on based on those dates, costs, and revenue.

  • A. By week, how much am I going to spend buying inventory (sum of Cost X, by week based on Date A)
  • B. By week, how much cash am I going to generate selling my inventory (sum of Rev Y, by week based on Date B)
  • C. By week, how much inventory do I have (Sum of Cost X, based on Dates A and B)

Any thoughts on how to do this??

Saw this originally cross posted on Reddit, and they provided some tips on cross table implementations. Upon seeing it again I was wondering if we perhaps are overthinking this and it could be accomplish in one table by using grouping.

AT can autosum (or average, a few other calcs) figures in groups. So if instead of going multiple tables, you just include the WEEKNUM() formulas in your single table, you can sort into groups by your weeknum to deliver at least A & B. You can also sort or subgroup to perhaps achieve C (I’m a bit unclear what you need from that one. 

I slapped together a sample structure, screenshot below. The idea is you’d have a few views for your needed calculations, so you can see the grid views “All Fields” “Spend” and “Projected Revenue”. 


Hi, 
Add 2 formula fields, WEEKNUM(Date A) , same for B
Under Cost field, select Summary type: Sum

You can group by WEEKNUM A (Collapse all helps to Zoom Out your data) or WEEKNUM B, to quickly evaluate costs
If you need to find cost based on both dates, grouping both might be a mess, so ungroup it and enable filtering according to your needs