While scoping a new Airtable solution for a client, the topic of forecasting came up and specifically by employing machine learning. There are many definitions of machine learning and while my focus was to at least prove to myself that a Script Block could perform the forecasting process natively (i.e., without calling out to any external services), I took a stab at crafting a simple data science block to forecast sales by month for the next three years.
Setting the Table - Aggregation by Month/Year
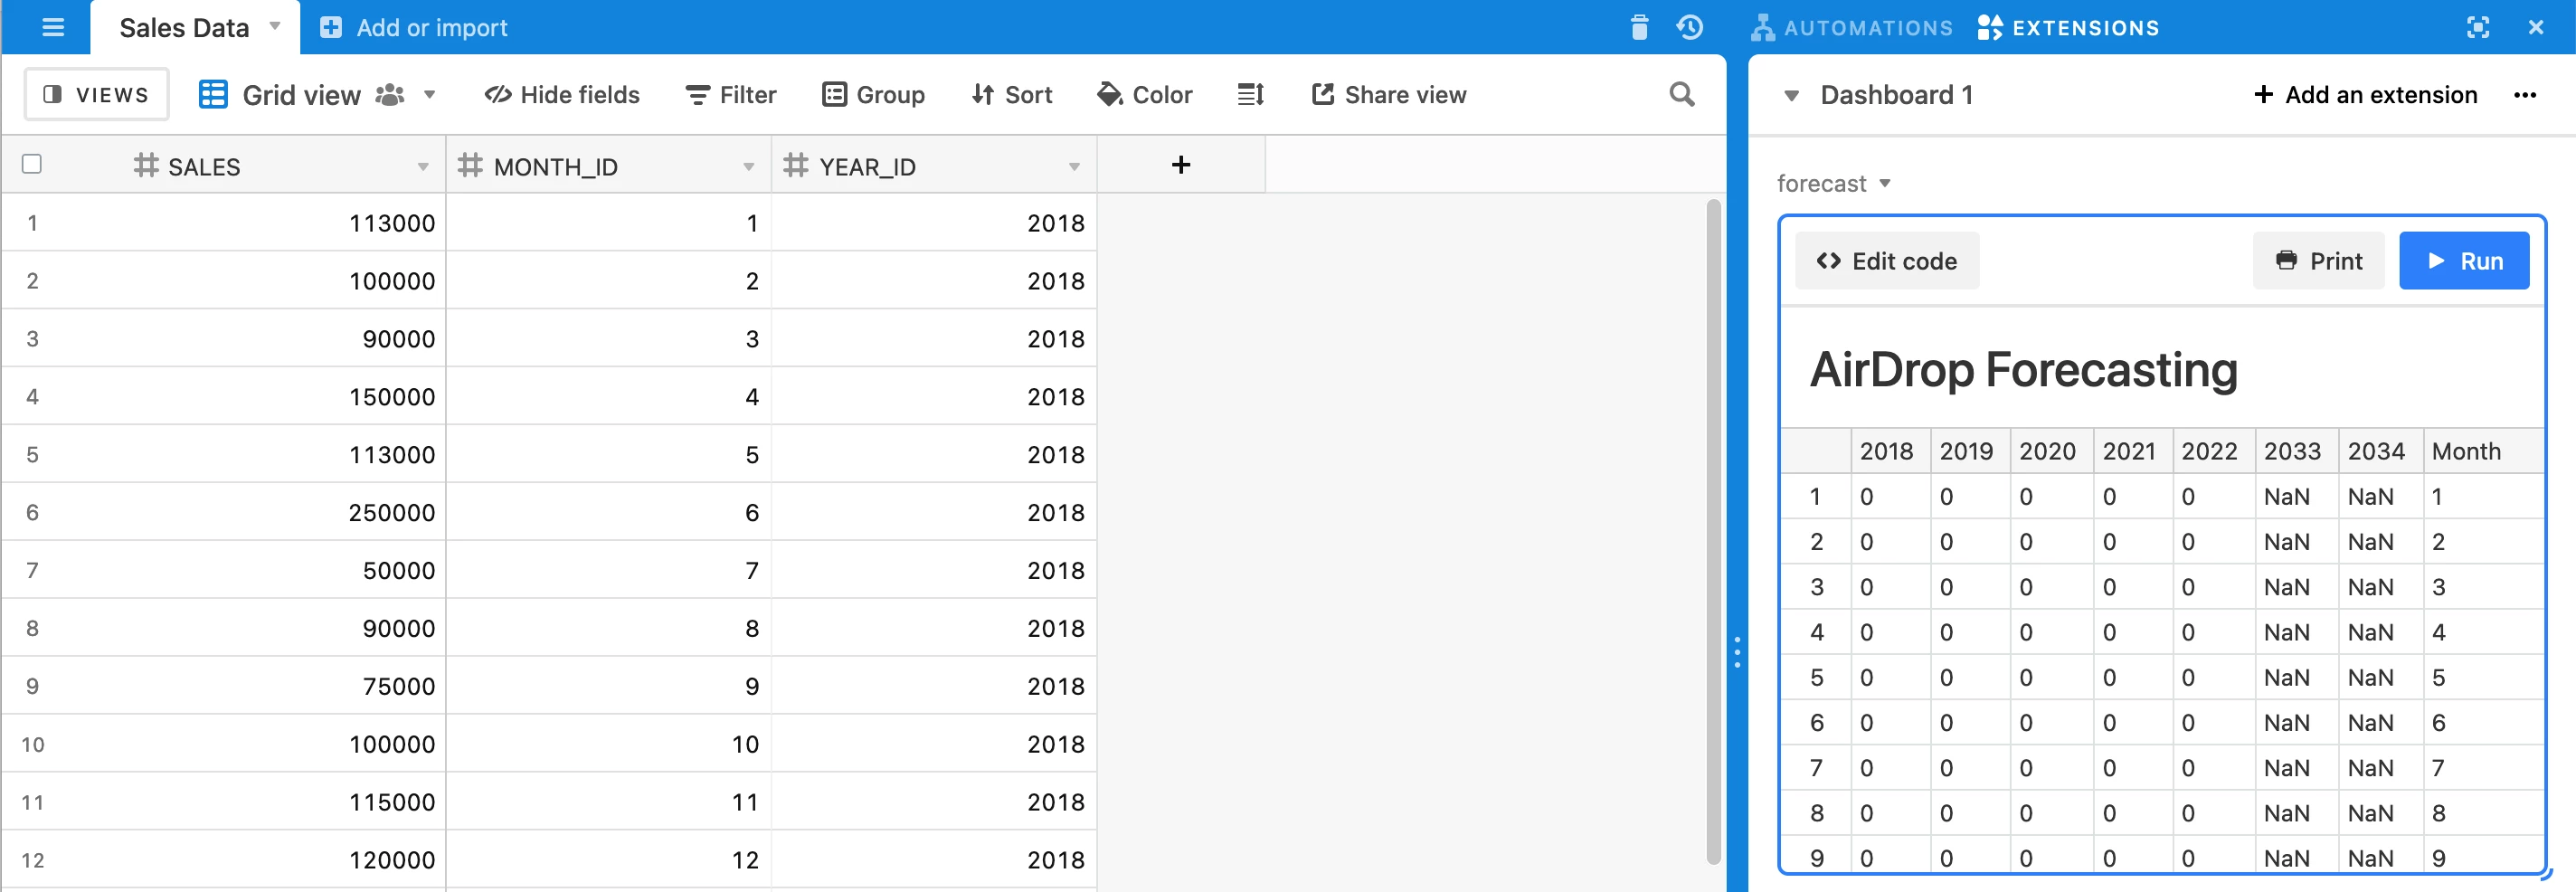
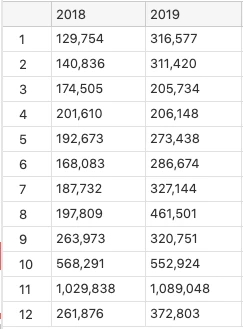
The sales data exists in a table which includes about 3,000 transactions spanning 2018 and 2019. Instead of using roll-ups or formula fields I decided to see how well the Script Block was able to perform the aggregation of sales by year and month.
The objective is simple – total sales by month and year. The performance of this part of the process is blistering fast; about 1.3 seconds.
Forecasting Algorithm
As I mentioned, there are many AI approaches to forecasting but I self-constrained this project to allow me to keep it simple; the model has two key requirements:
- It must be native Script Block code;
- It must be able to learn as the actual sales data expands.
Many of the forecasting models in AI require GPU’s to process and employ relatively sizeable model resources. As such, I chose an algorithm that I can code in every-day javascript using triple exponential smoothing which explicitly adds support for seasonality to the univariate time series. This method is sometimes called Holt-Winters Exponential Smoothing, named for two contributors to the method: Charles Holt and Peter Winters. In addition to the alpha and beta smoothing factors, a new parameter is added called gamma (g) that controls the influence on the seasonal component.
How it "Learns"
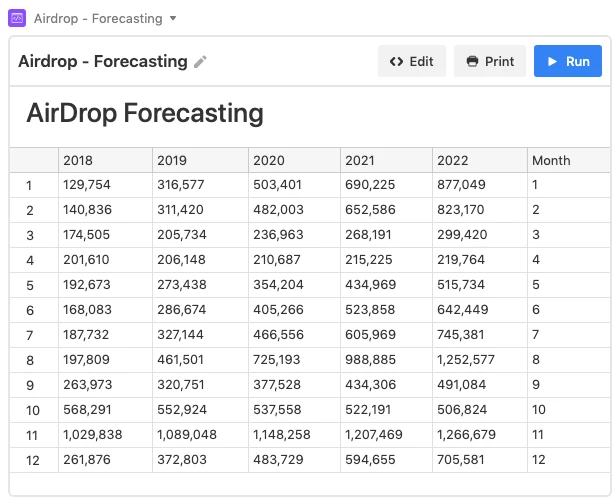
The script is designed to utilize historical data (2018/2019) to forecast 2020. Then it automatically expands the next forecast to use three year’s data (2 historical values for each month plus one forecast value) to determine yet another forecast value. As the future inches forward and actual data expands, the forecasting process becomes increasingly more intelligent and likely more precise.
Why Not Use Formulas?
Airtable formulas are wonderful tools, but they tend to work against you in complex processes. And in some case, they expand dependencies and the number of fields in your data model to the point where it’s difficult to manage and maintain.
Examples like this make it abundantly clear - script-based blocks have a very bright future for Airtable builders because they demonstrate how to craft complex computational features that interchange with other data processes and reporting requirements. Formulaic-based processes will never be able to achieve these objectives, nor should they be expected to. Imagine how difficult it would be to replicate this script as a formula. It might be possible but it would be very ugly indeed.
The question is [rather] …
Why not make it possible for Script Blocks to become formulas?
What Next?
This example doesn’t make any assumptions about what to do with the forecasted values; that’s up to you. As a simple block app it’s useful in a variety of forecasting use cases as is. It could be applied to any time-series data as a prediction tool.
With this data and the power of integrated javascript in the block, this data grid can be updated to another table, or emailed as a report, or incorporated into many other use cases. Instantiated as a table that is updated from time-to-time, it could drive data visualizations with other blocks.
AirDrop
A few people have asked about the name “AirDrop”. This is just a tag name I have assigned to a class of scripts I openly share with the Airtable community. It helps me keep my script libraries organized so I can remember what has been sanitized for open sharing. “AirDrops” are not declared under an open-source license, but they are offered here for anyone to use to learn from or shape into other solutions.
Here’s the complete code… enjoy.
/*
***********************************************************
Airdrop - Forecasting
Copyright (c) 2020 by Global Technologies Corporation
ALL RIGHTS RESERVED
***********************************************************
*/
// get the table name
let sourceTableName = "Sales Data";
// display app title
output.markdown('# AirDrop Forecasting');
// get the source data
let sourceTable = base.getTable(sourceTableName);
// get the data set for 2018/2019
let result = await sourceTable.selectRecordsAsync();
// set a counter for testing
var count = 0;
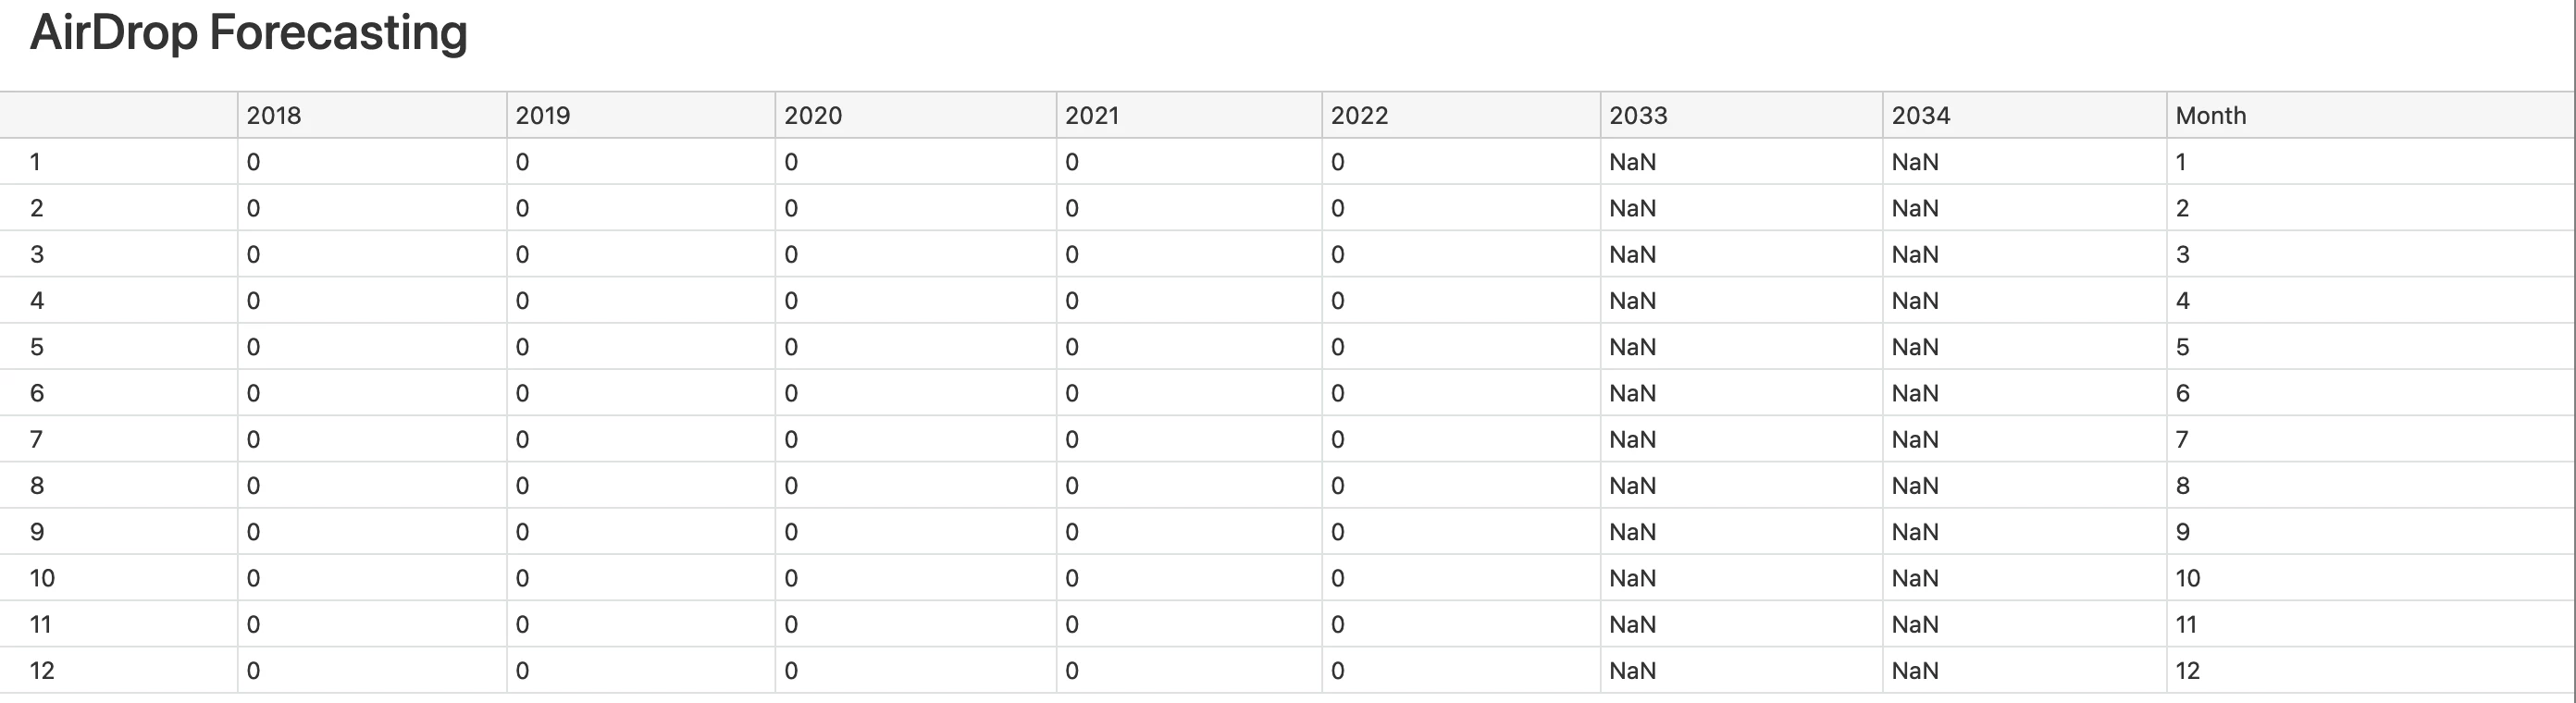
// build the dataframe
var aDataFrame = [];
for (var i = 1; i < 13; i++)
{
aDataFrame.push({
"Month" : i,
"2018" : 0,
"2019" : 0,
"2020" : 0,
"2021" : 0,
"2022" : 0
});
}
// iterate across all the records
for (let record of result.records)
{
if ((record.getCellValue("MONTH_ID")) && (record.getCellValue("YEAR_ID")) && (record.getCellValue("YEAR_ID") != "2005") )
{
updateDataFrame(record);
count += 1;
}
}
//
// compute the future
//
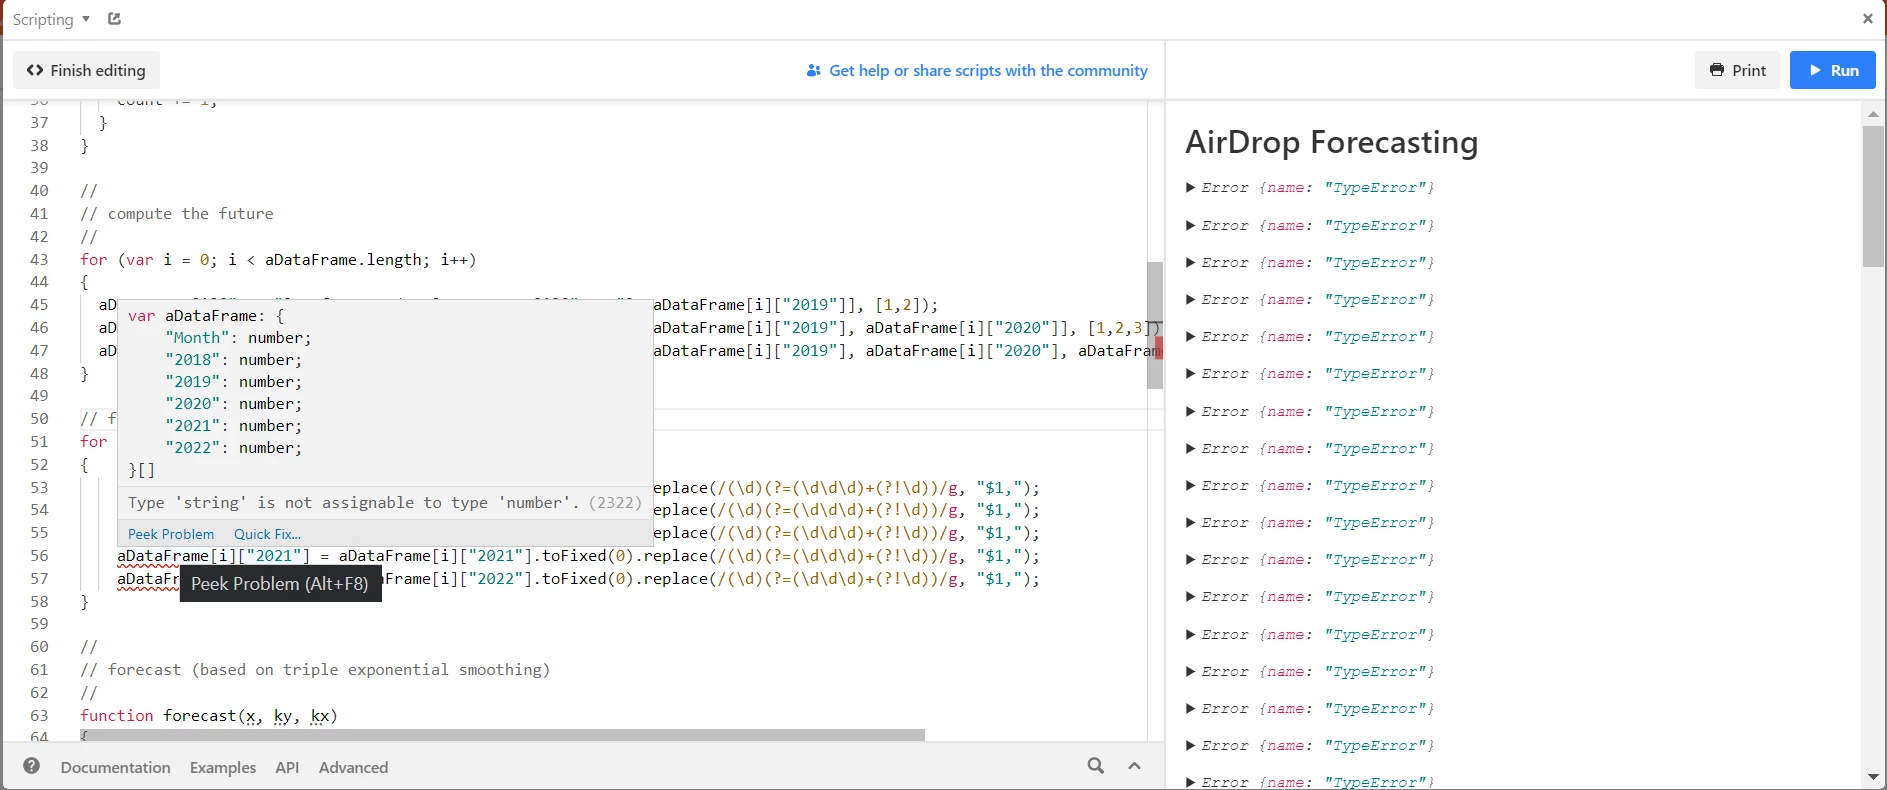
for (var i = 0; i < aDataFrame.length; i++)
{
aDataFrame[i]["2020"] = forecast(3, [aDataFrame[i]["2018"], aDataFrame[i]["2019"]], [1,2]);
aDataFrame[i]["2021"] = forecast(4, [aDataFrame[i]["2018"], aDataFrame[i]["2019"], aDataFrame[i]["2020"]], [1,2,3]);
aDataFrame[i]["2022"] = forecast(5, [aDataFrame[i]["2018"], aDataFrame[i]["2019"], aDataFrame[i]["2020"], aDataFrame[i]["2021"]], [1,2,3,4]);
}
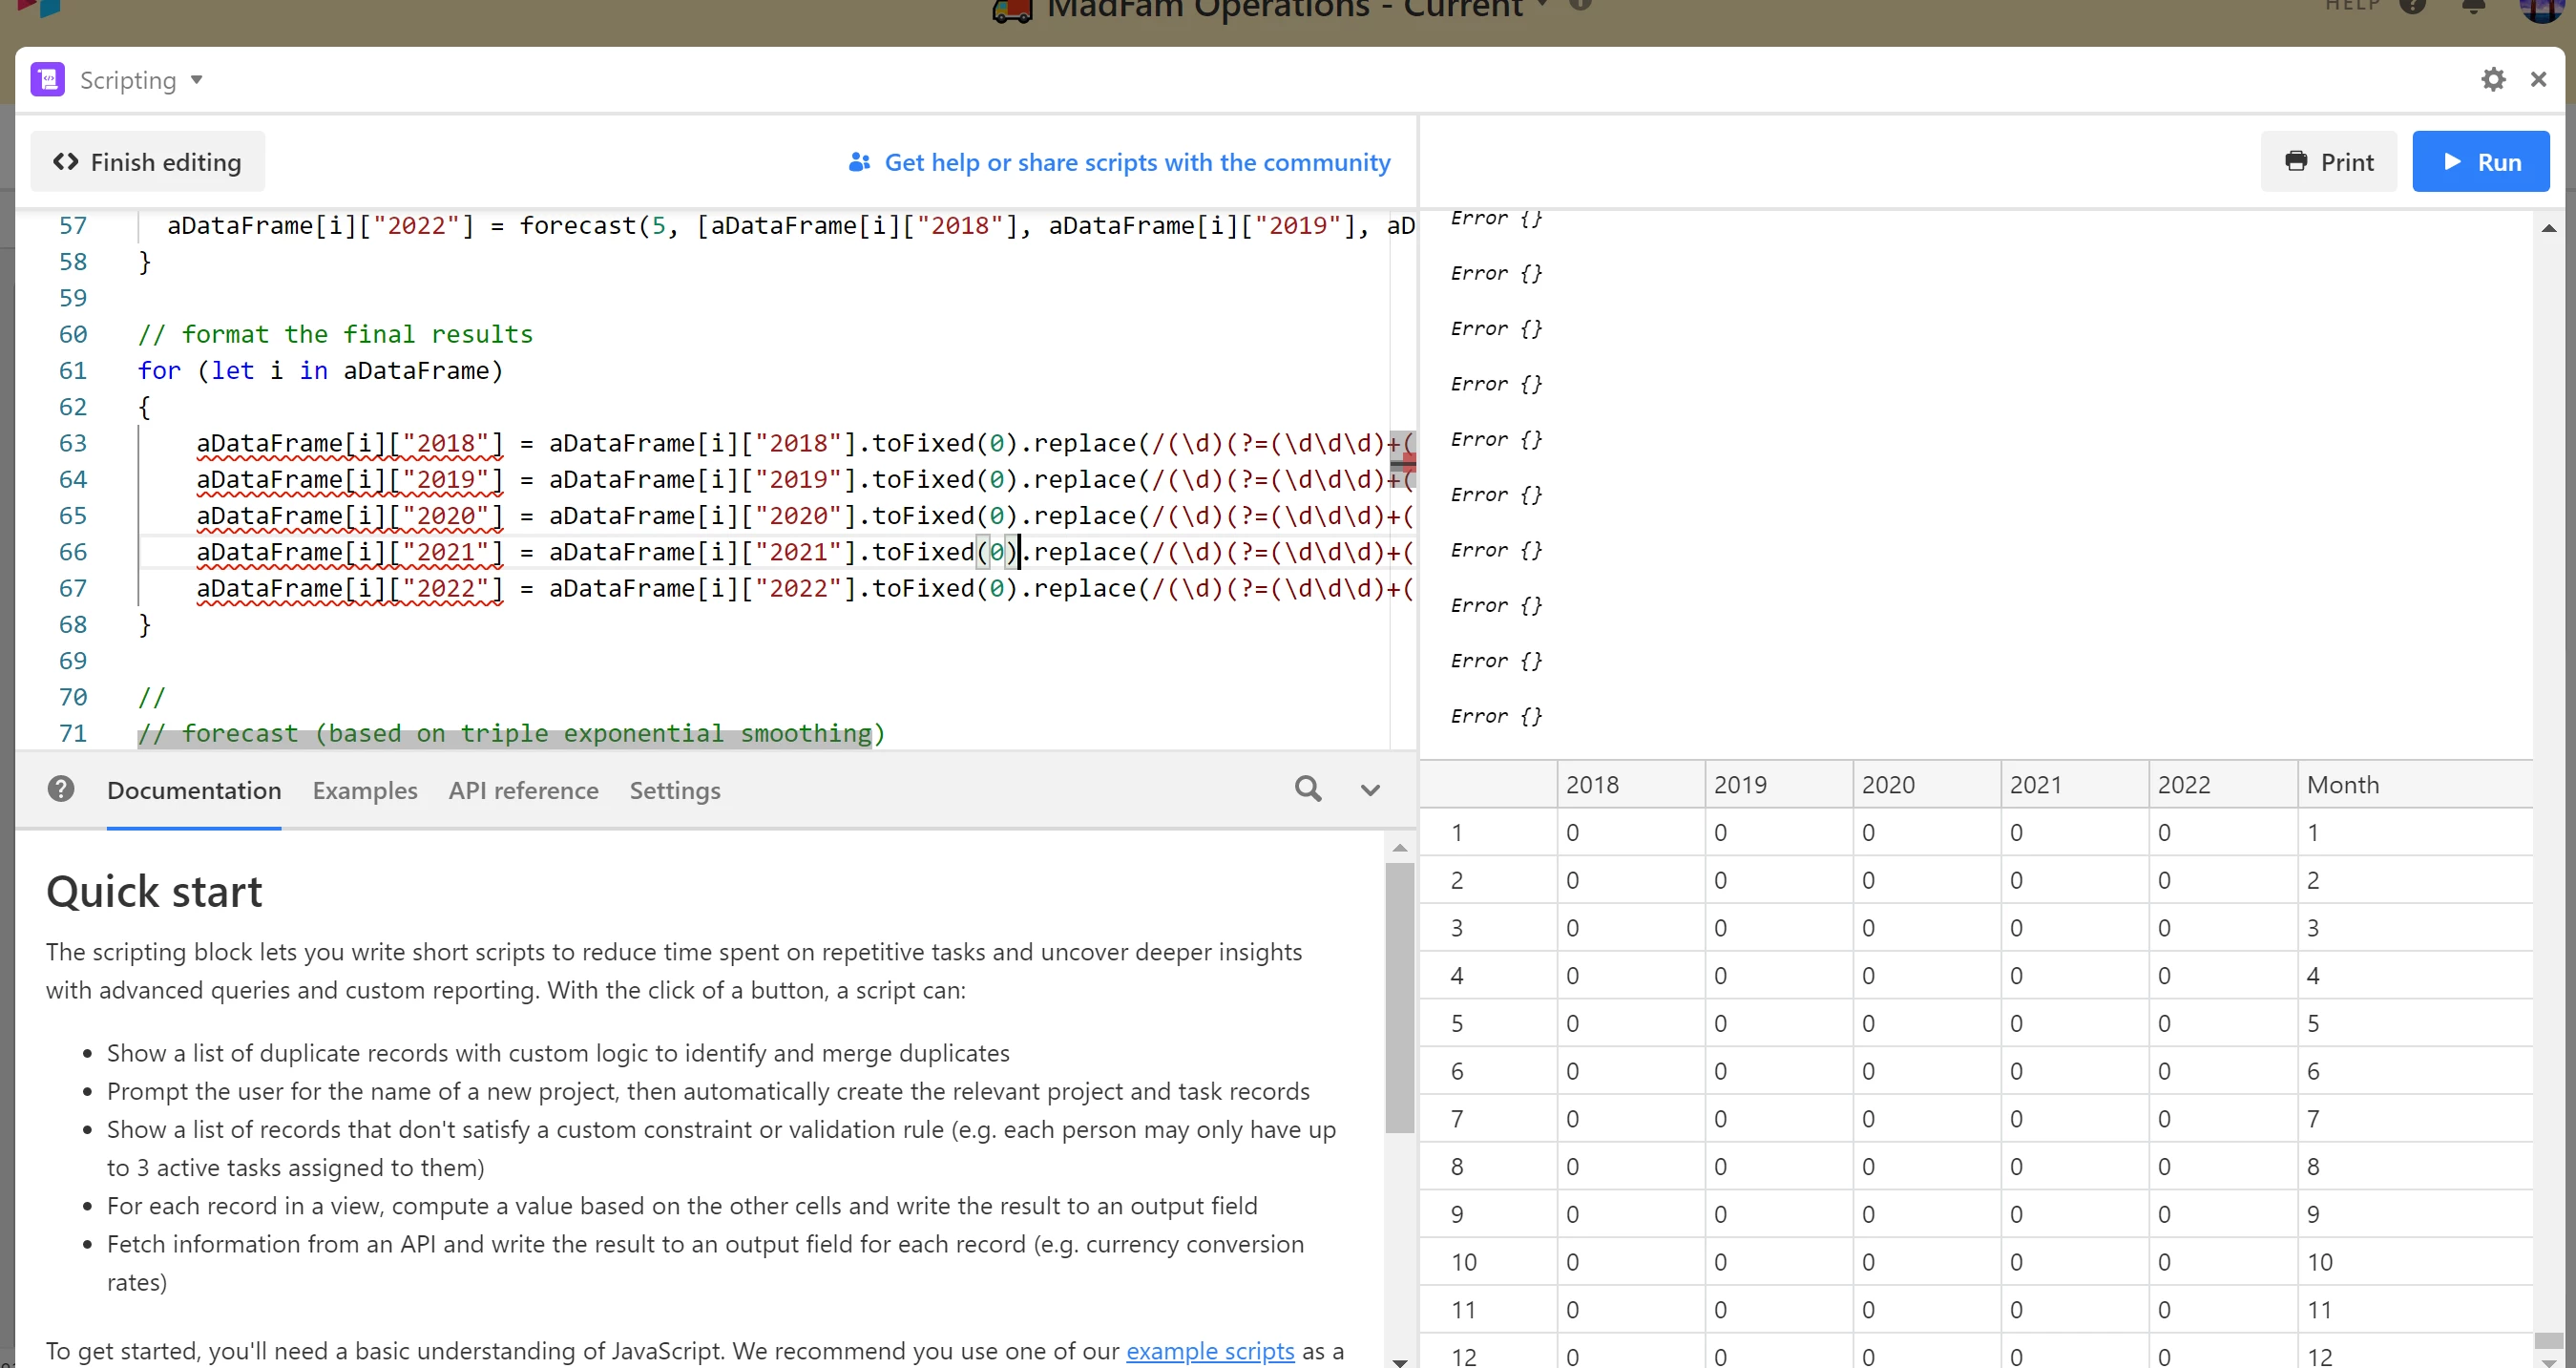
// format the final results
for (let i in aDataFrame)
{
aDataFrame[i]["2018"] = aDataFrame[i]["2018"].toFixed(0).replace(/(\d)(?=(\d\d\d)+(?!\d))/g, "$1,");
aDataFrame[i]["2019"] = aDataFrame[i]["2019"].toFixed(0).replace(/(\d)(?=(\d\d\d)+(?!\d))/g, "$1,");
aDataFrame[i]["2020"] = aDataFrame[i]["2020"].toFixed(0).replace(/(\d)(?=(\d\d\d)+(?!\d))/g, "$1,");
aDataFrame[i]["2021"] = aDataFrame[i]["2021"].toFixed(0).replace(/(\d)(?=(\d\d\d)+(?!\d))/g, "$1,");
aDataFrame[i]["2022"] = aDataFrame[i]["2022"].toFixed(0).replace(/(\d)(?=(\d\d\d)+(?!\d))/g, "$1,");
}
//
// forecast (based on triple exponential smoothing)
//
function forecast(x, ky, kx)
{
var i=0, nr=0, dr=0,ax=0,ay=0,a=0,b=0;
function average(ar) {
var r=0;
for (i=0;i<ar.length;i++){
r = r+ar[i];
}
return r/ar.length;
}
ax=average(kx);
ay=average(ky);
for (i=0;i<kx.length;i++){
nr = nr + ((kx[i]-ax) * (ky[i]-ay));
dr = dr + ((kx[i]-ax)*(kx[i]-ax))
}
b=nr/dr;
a=ay-b*ax;
return (a+b*x);
}
//
// display the forcasted dataframe
//
output.table(aDataFrame);
//
// update dataframe
//
function updateDataFrame(record)
{
try {
var yearID = parseInt(record.getCellValue("YEAR_ID")) + 15;
var itemID = findElement(aDataFrame, "Month", record.getCellValue("MONTH_ID"));
aDataFrame[itemID][yearID] += record.getCellValue("SALES");
} catch(e) {
output.inspect(e);
}
return(true);
}
//
// find an element in the aggregate list
//
function findElement(arr, propName, propValue)
{
for (var i = 0; i < arr.length; i++)
{
if (arr[i][propName] == propValue)
return i;
}
}