Hi @carl_gough,
Thanks for reaching out about configuring your blocks!
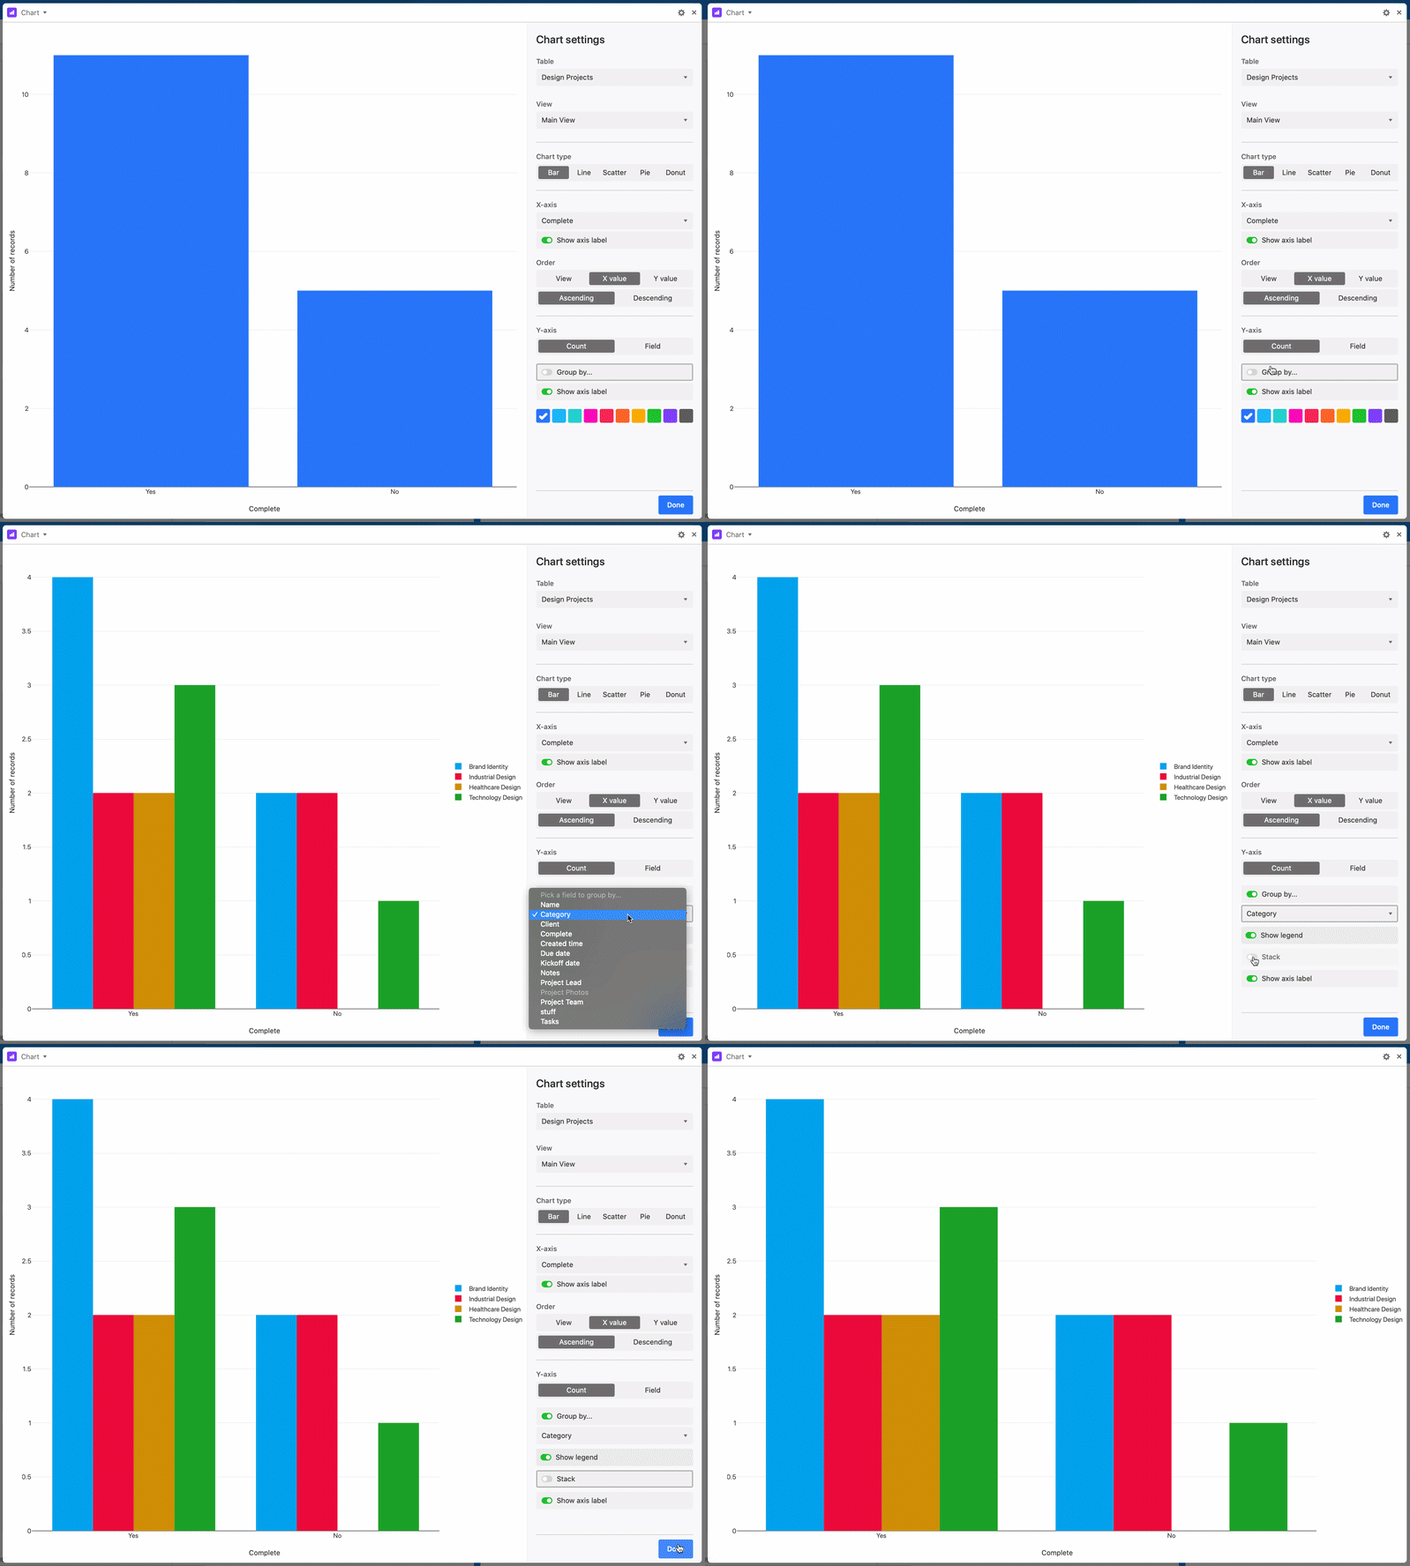
It sounds like the chart block might address your needs here. Based on a particular view, you can group data so that it’s more granular and easier to interpret quickly:

Given that you’re hoping to see several different data points in one visualization, it’s possible you may need two separate chart blocks to include all of the information. I wonder if a pivot table might also work here, but you might run up against the same issue.
You can read about Airtable Blocks here or by clicking “Install Block +” in a blocks dashboard within your base! I hope my suggestions get you started in the right direction, but if you come up with a different solution that works well, please feel free to share here.


