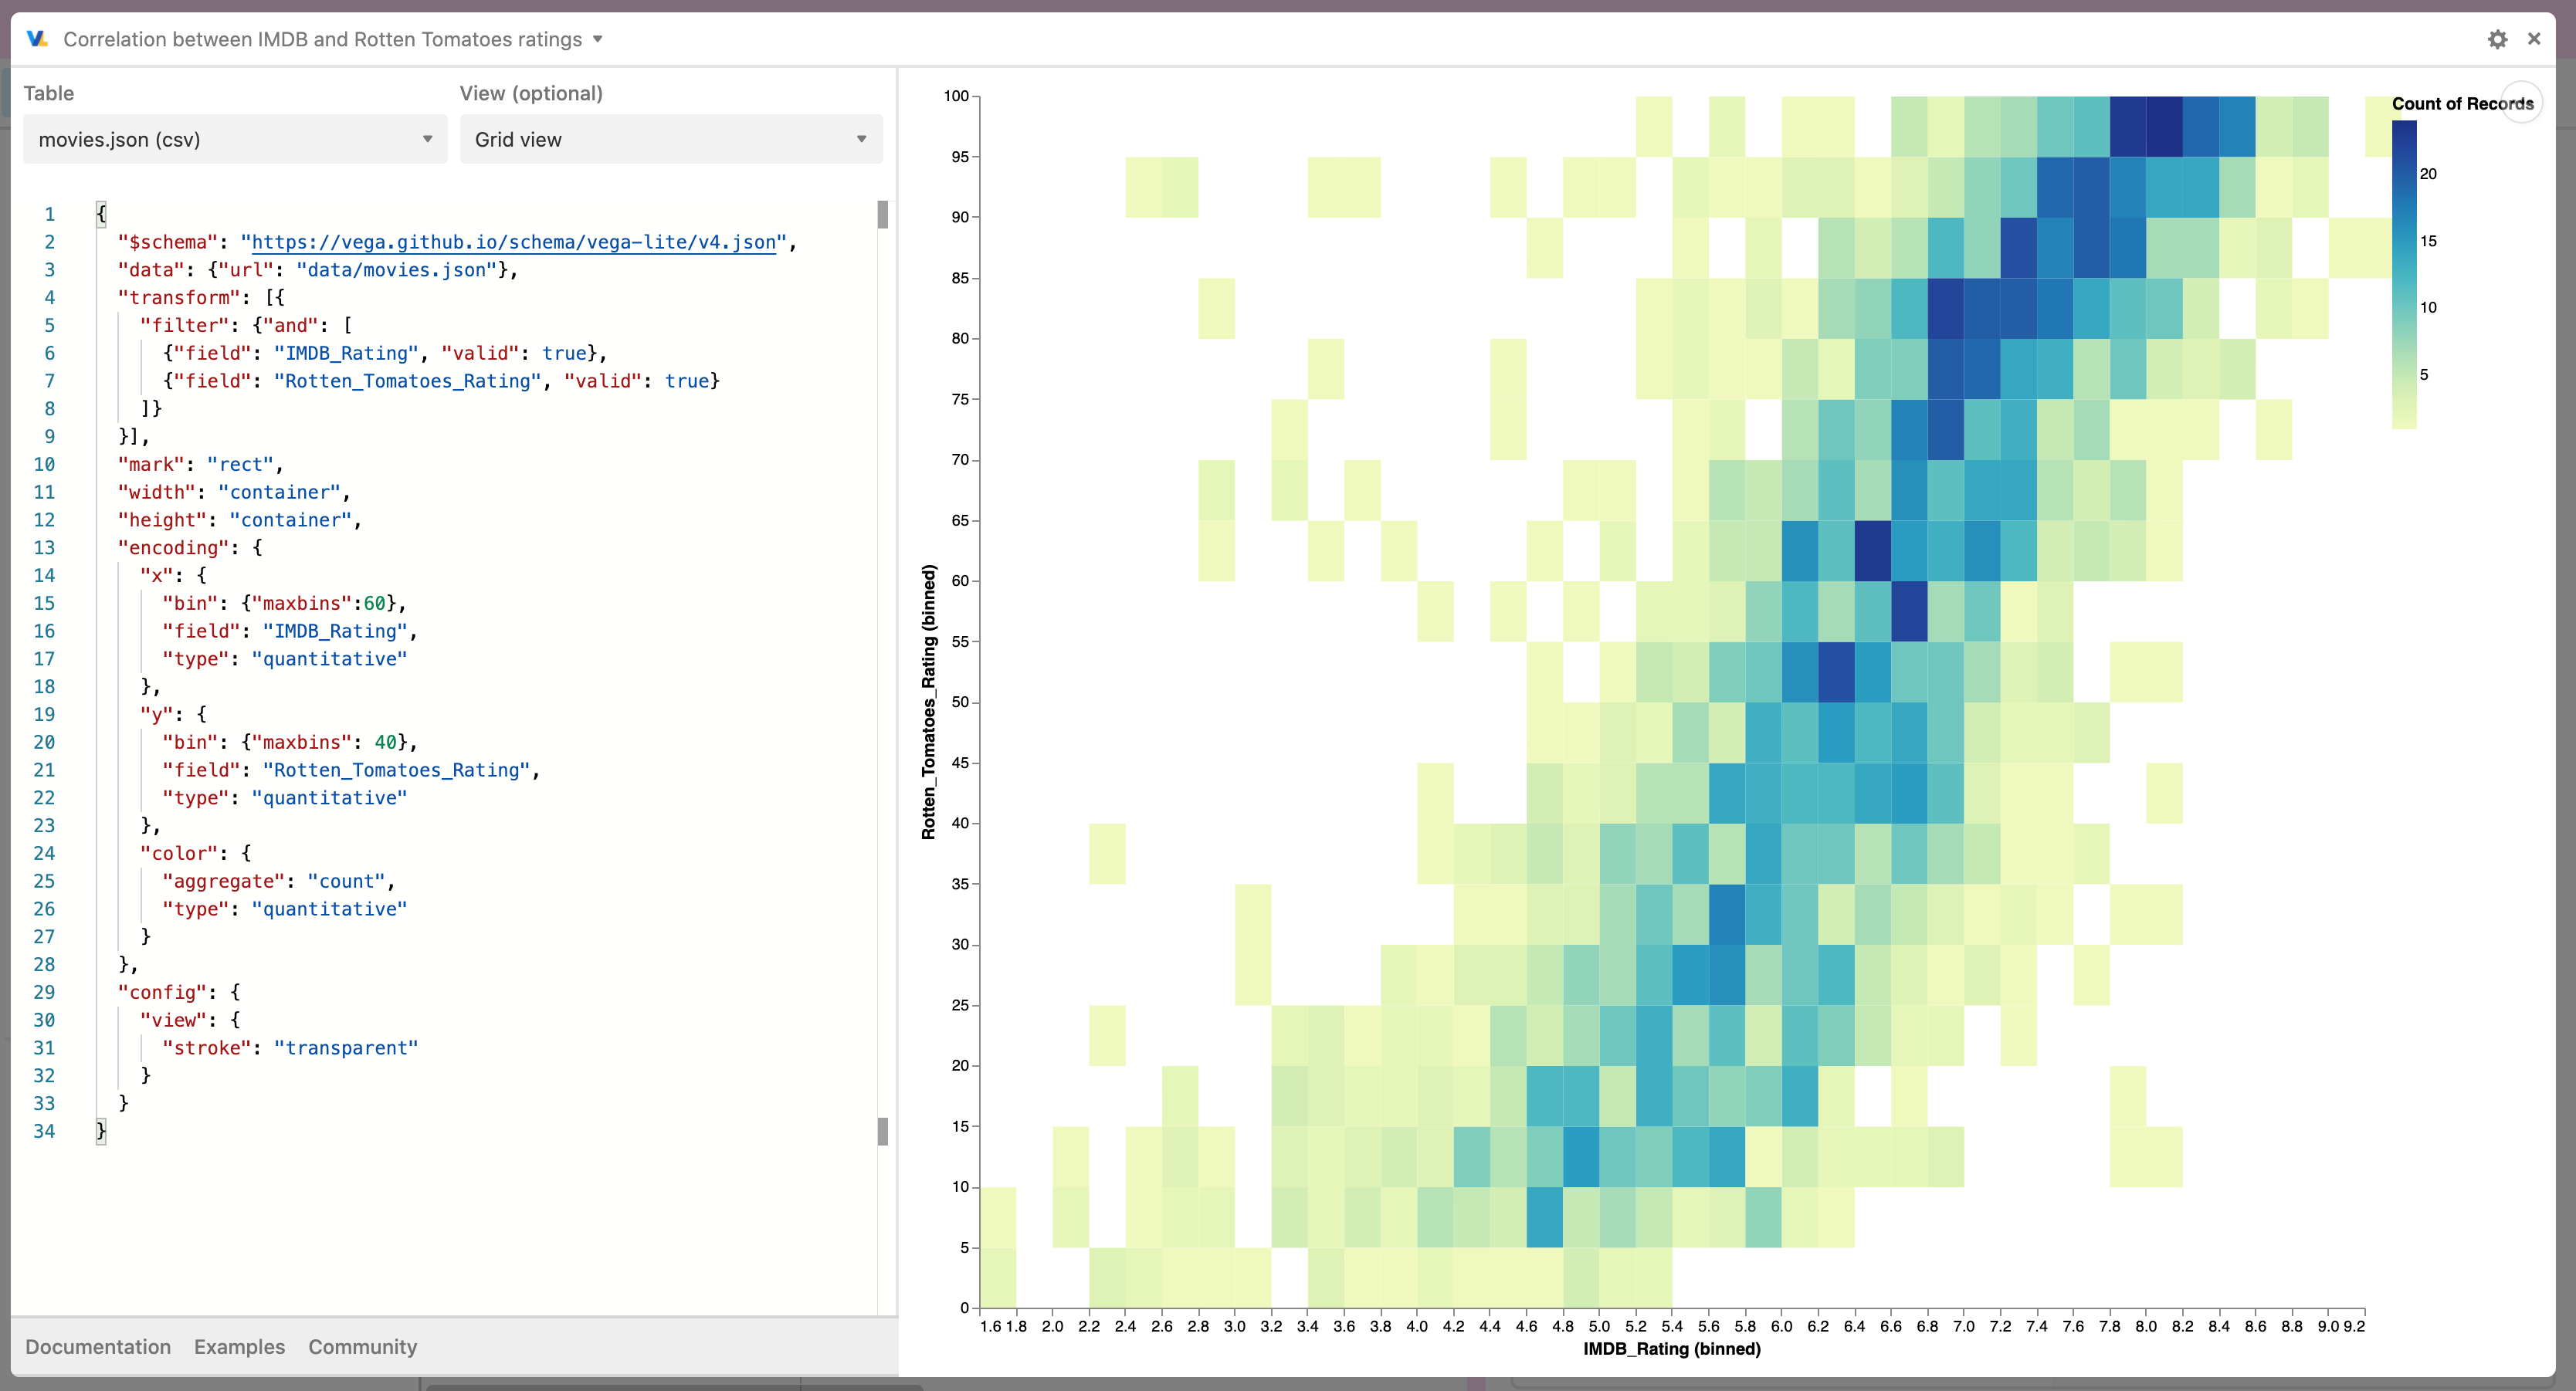
This is one of the smartest moves by Airtable in 2020. As I suggested in 2018 (or maybe it was 2017) -
When it comes to charting and data visualizations, no company can predict the features that a customer base will need. Charting and other visualization solutions must favour the deep knowledge of open-source libraries that are based on massive input from actual customers.
Two enthusiastic thumbs up!!!
Now, imagine a Script Block that generates Vega-Lite code. :winking_face: How will Script Blocks push code content into a Vega-Lite Block?
Um, how about also making the Vega library part of the Script Block platform? Then, developers can integrate arbitrary data, build dynamic Vega definitions, incorporate more complex script processes, etc.
The source code for this block is now available: https://github.com/Airtable/blocks-vega-lite
Oh man… this is so cool! I echo @Bill.French – this is an incredible addition. I’m not a data-scientist at all, and very amateur at creating data visualizations, but even just the ability to overlay graphs is a massive boon

@Kasra, I’m sure you are already aware, but I do want to point out that the editor is incredibly sluggish – frustratingly so. But none-the-less, a super cool block.
Hmmm, I have not had the displeasure of experiencing this. I wonder if it’s because my tests aso far] have been with smaller tables. I do run a workstation with 64GB memory in a 4 core platform.
Oh man… this is so cool! I echo @Bill.French – this is an incredible addition. I’m not a data-scientist at all, and very amateur at creating data visualizations, but even just the ability to overlay graphs is a massive boon

@Kasra, I’m sure you are already aware, but I do want to point out that the editor is incredibly sluggish – frustratingly so. But none-the-less, a super cool block.
Indeed, one of the biggest trends emerging is the goal of making us all into data scientists. Airtable is in a unique position to blend the simple and elegant world of data creation and management with the complex and often unreachable aspects of powerful data visualizations. This is all about affordable luxuries.
Airtable must not be seen as just a database/spreadsheet/forms platform - it must transition into a tool that helps every-day business users tell stories with data. The Vega-Lite block is just one additional bold step in that direction. And I would ask that the dev team double down on this idea by considering these incremental enhacements:
Support 100% of the Vega-lite declarations including data (charting is not always about a single table).
Make it possible for Vega-Lite grammars to work in Script Blocks.
Make it possible for Script Blocks to inject data and grammars into the Vega-Lite Block.
Make it possible for the data node in Vega-Lite to pull from a field containing JSON data.
Make it possible for a field (containing JSON data) to plot a sparkline chart must the way attachments render a thumbnail.
Make it possible for the API to create Vega-Lite blocks.
Oh man… this is so cool! I echo @Bill.French – this is an incredible addition. I’m not a data-scientist at all, and very amateur at creating data visualizations, but even just the ability to overlay graphs is a massive boon

@Kasra, I’m sure you are already aware, but I do want to point out that the editor is incredibly sluggish – frustratingly so. But none-the-less, a super cool block.
And for those wondering - what’s the big deal? The charts block is just dandy, right? Take a look at what’s now possible with Vega-Lite and some JSON declaration statements.
Try to do this in Chart Block:

Or this…

Or this…

Hmmm, I have not had the displeasure of experiencing this. I wonder if it’s because my tests sso far] have been with smaller tables. I do run a workstation with 64GB memory in a 4 core platform.
Ya, I guess it’s definitely a limitation of my machine then. I probably had far too many apps running in the background, as is my wont
, eating up my limited 16GB memory.
@Jeremy_Oglesby does the editor feel any faster now? We made some tweaks that should hopefully help.
I noticed absolutely no difference on my 64GB Mac; it’s blistering fast then and now. :winking_face:
@Jeremy_Oglesby does the editor feel any faster now? We made some tweaks that should hopefully help.
@Kasra
Yes, it definitely does feel faster now. I don’t remember exactly what all applications I might have had running while trying to work with the block the first time when I expressed my frustration, so I’m likely not able to make a perfect comparison to that state… but with what I have open right now, I can say that I was not frustrated with choppiness in the editor while the graph tried to re-render on the fly.
So thank you!
@Bill.French … we get it … you’ve got a biiiiiiiiiiig computer :winking_face:
And yet, it feels so tiny when I try to process the person count of an image with 100,000 people in it.
Is it possible to get access to this still? I’d love to play around with it but I can’t install it on my dashboard, it doesn’t show up in the blocks…
The coding panel jumps around constantly for me- is this due to my computer capability? Any suggestions to improve it? Thanks!
Which version of Vega-Lite is used by this app?
Does Airtable’s Vega Lite app allow for interactivity, as shown in this Python API (Altair, see Github) that translates into the JSON script for the chart:
alt.Chart(source).mark_circle(size=60).encode(
x=‘Horsepower’,
y=‘Miles_per_Gallon’,
color=‘Origin’,
tooltip=b‘Name’, ‘Origin’, ‘Horsepower’, ‘Miles_per_Gallon’]
).interactive()
I believe it will work as long as it is supported in VegaLite.
Has anyone experienced a glitchy behavior with the scripting in the Vega-Lite block? It seems when I’m editing the script, Airtable starts to do lots of auto saves which, make it impossible to work in the Vega-Lite script at that point. I have to close the block and reopen but doesn’t seem to fix. Also, I’m in the browser (Chrome). Not sure if it would be different in the desktop app.
It appears as though properties such as “repeat” and “layer” are no longer permitted with the Vega Lite block. Is this on purpose? If so, the basic use case of a line graph with multiple series is no longer possible.