Event Recap: Mapping with AI | November 13

  • October 31, 2025
  • 1 reply
  • 85 views

MaddieJ
Forum|alt.badge.img+24
  • Community Manager
  • 177 replies

Hey Enterprise Network!

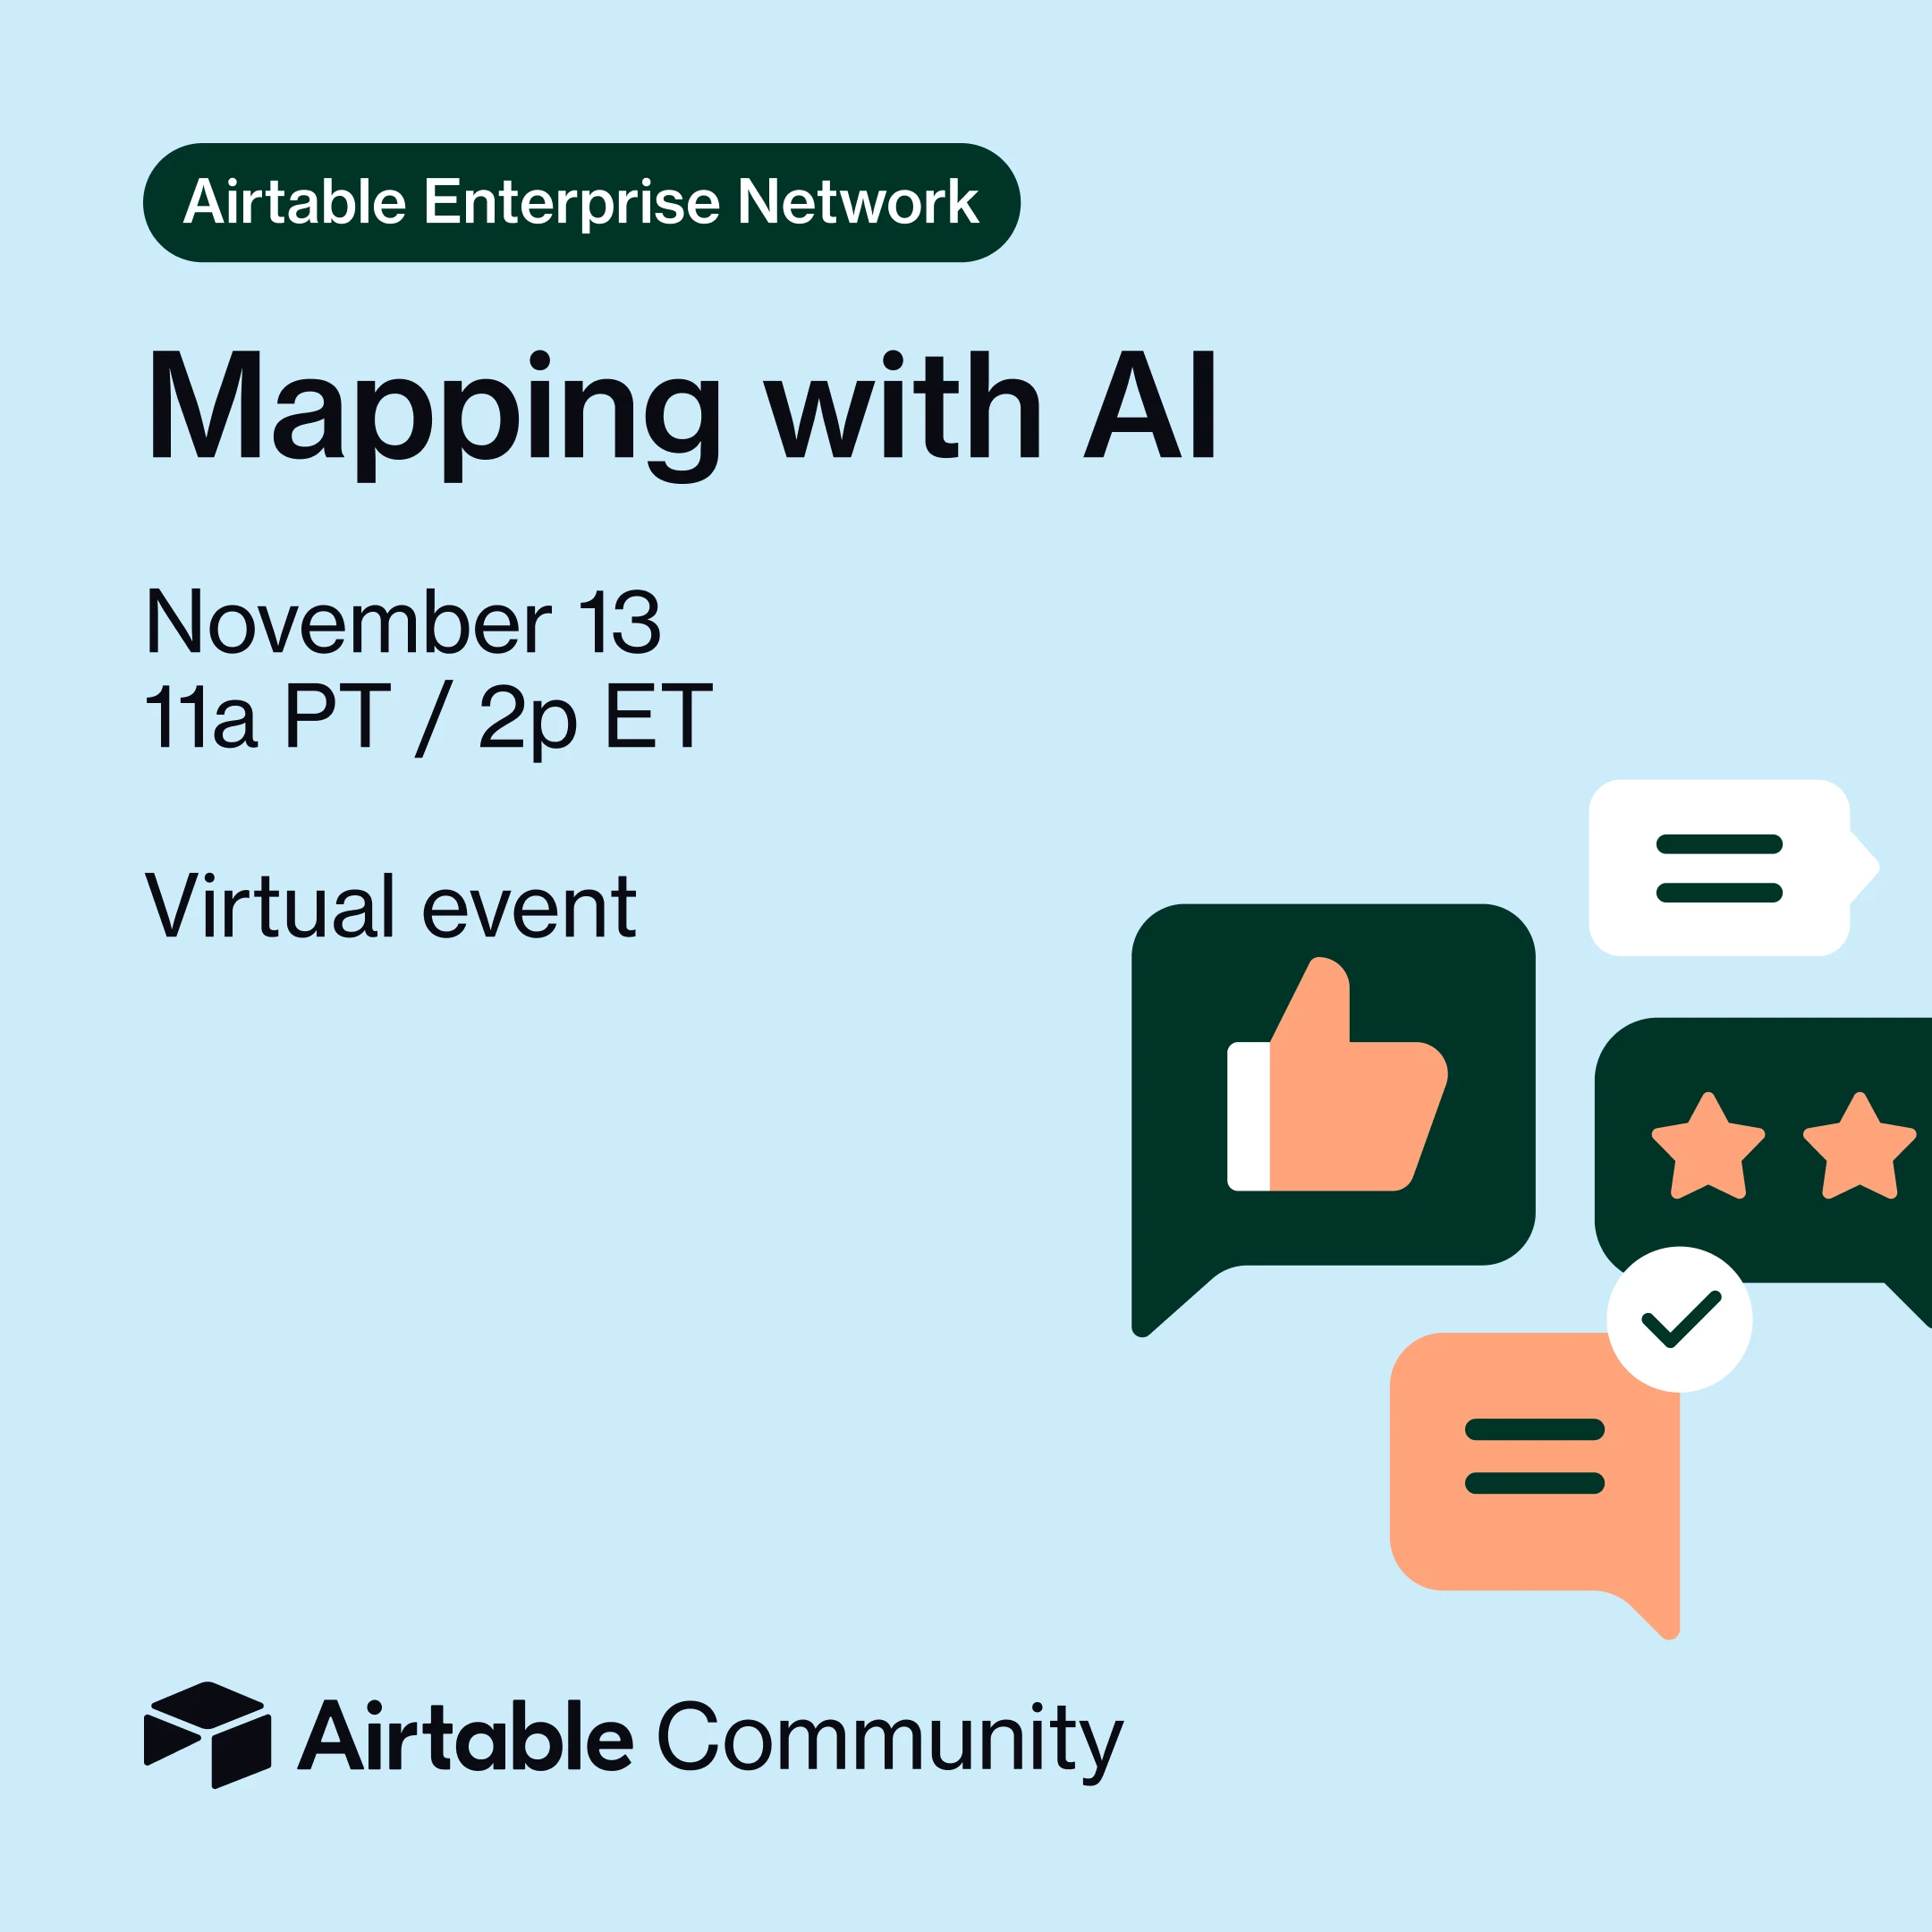
Join us for a 30-minute virtual event on November 13 as we explore how Airtable Omni and the Interface Extensions SDK can transform spatial data into interactive maps—right inside your interfaces.


You’ll learn how to:

  • 🧠 Build AI-generated mapping interfaces with Omni (no code needed!)

  • ⚙️ Go deeper with our Interface Extensions SDK

  • 🌾 See real-world examples, like mapping cattle movement and analyzing location data


You’ll also get to hear from familiar faces in the Community, ​@MatteoCrOps and ​@MilhoanDesign!


Whether you’re visualizing enterprise data or building powerful analytical tools, this session will show new ways to visualize, analyze, and create with Airtable.


👉 Register now to secure your spot.


We look forward to seeing you there!


1 reply

MaddieJ
Forum|alt.badge.img+24
  • Author
  • Community Manager
  • 177 replies
  • November 14, 2025

Thanks to everyone who tuned into this event! It was an awesome session where we saw how Omni can generate interface elements, and the Airtable Interface Extensions SDK can turn creative ideas into powerful, custom solutions—like mapping cattle grazing patterns right inside Airtable.

2 Key Takeaways 👀

  • The Airtable Interface Extensions SDK enables you to build custom visualizations and interactive maps directly within Airtable, making it possible to track and manage real-world data—like cattle movement—using shape files and live data overlays.
  • Integrating shape files and using tools like Mapbox and Google Maps SDK, you can visualize pasture utilization, grazing plans, and more, with color-coded insights that help optimize land management. The process is accessible, and even complex calculations (like grazing utilization) can be automated and visualized.


Catch up with the event recording below! 👇