Greetings, I put together a video that illustrates what I am looking for.
Transcript of video:
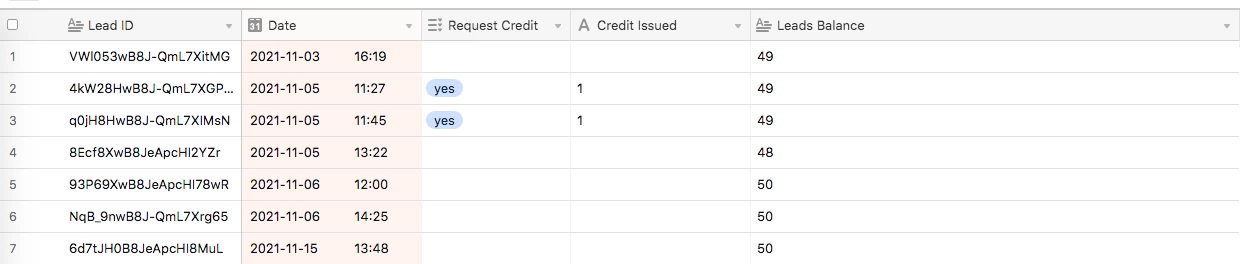
Greetings or table community. So what I’m trying to do is I’m trying to have this column, the leads balance column reflect the amount of leads that are left.
So we can see that the, each, each row is a new lead and it’s organized by the date. And we can also see that we have our two columns here, requests credit and credit issued.
So the workflow is that a client would potentially request a credit just by selecting the column and by selecting. Yes.
And if they select, yes, then I ideally would get an email notification and then would have to request a credit.
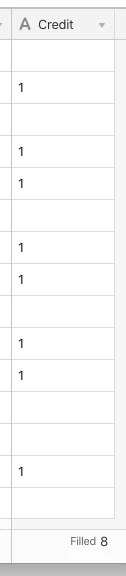
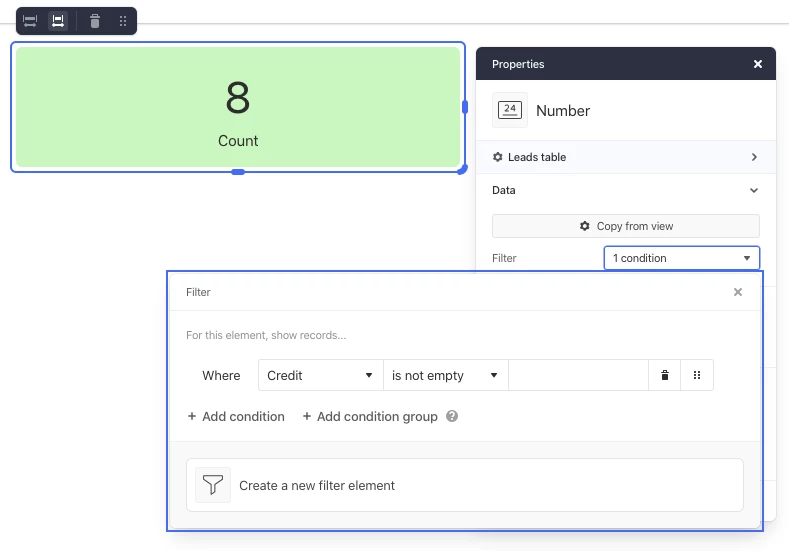
Once the credit is approved, I would place a one in this column. And then that would show the balance here.
So in the, our leads balance, I’m using the customized field type, I’m using the formula and I’m trying to figure out what formula to use.
I’m used to Excel some, having some difficulty trying to figure this out. So like for example the first column there would be 49 49 leads.
Let me see here. Okay. Let me just change the field type, just to give an example, is that right. So the first one, there would be 49, no, sorry, 49.
And then this would be, would still be 49 because this lead was generated, but one issue was credit was credited saying here same for this cell.
And then here, this would be 48 so on and so forth. So, so just to reiterate, I’m looking for a formula for the leads balance.
So right here for the, I’m looking to see what the answer would be right here. So any feedback would be very much appreciated.
Thank you so much.