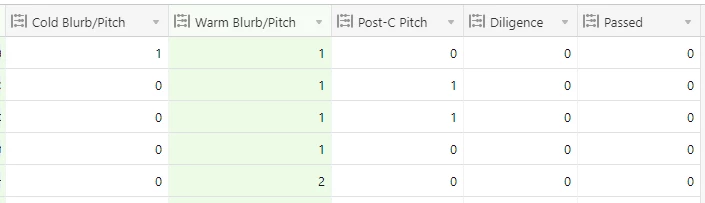
I have an Interactions and an Investors table. There are vaious interaction types as investors move from cold > warm > diligence, etc. These interaction types are managed via a single-select and piped in via various automations. Two metrics I’m trying to highlight using a number element in the Interface Designer:
Simplistically:
Cold → Pitch conversions
Pitch → Diligence conversions
So far, I tried grouping interactions by investor and leveraing rollups in the linked Investors table. Don’t think that’s the way. In my mind this looks like No status (0), Cold (1), Pitch (2), Diligence (3). For any investor, there could be 2 colds, 2 pitches, etc. It’s not always 1 per intercation type.
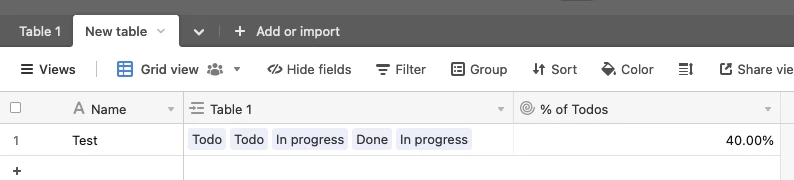
How might I go about deiving % of total interactions that converted into these two stages?
NB: At this point in the client’s project, major restructuring of the base is not an option.
Thanks friends!