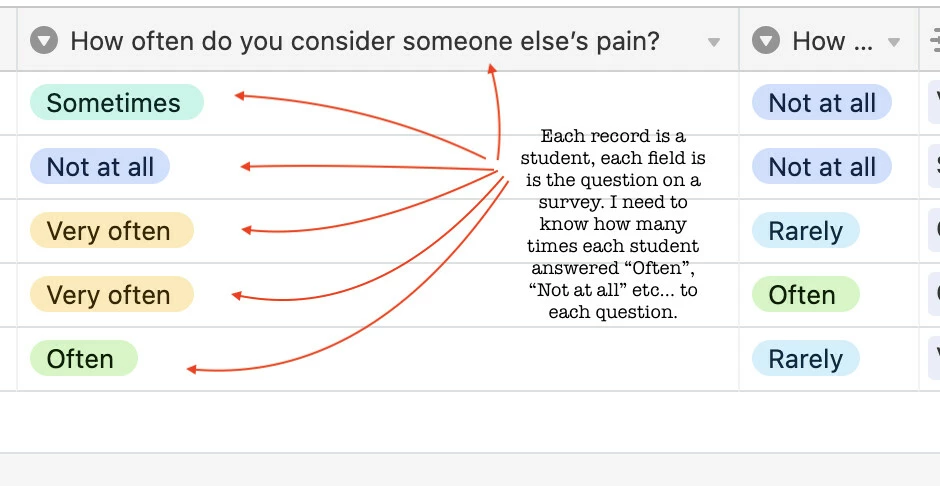
Here is an example of what I have. Each student has 5 choices in the answers. 15 questions, 30 students and 5 choices per question. I need to create a global pie chart for the percentages answered to each question.
In the example: How often do you consider someone else’s Pain?
The answers: Very Often, Often, Sometimes, Rarely, Not at all
I need the poercentage of how many students answered Not at all or often etc