
Not sure how to title this, too early to think of the proper name - but this is what I’m trying to accomplish and I can get one percent to work but the others fill in with Error or NaN.


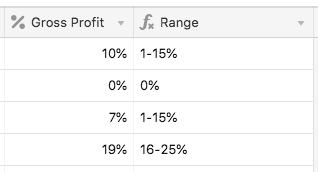
When Gross Profit percent is:


0%:

Formula is:

0%


gross profit: 1-15% formula reads: 1-15%

16-25%…

26-45%…

and so on up to 100%


Trying to group all gross profits based on the percent for graphing purposes.

I’d also like to know how to remove the Nan/Error if blank as these totals have not been figured yet. Not sure if the formula I was using is not working because the issues I was having with the previous formula.


Is this what you’re looking for?


Here’s the formula in the {Range} field. I only added the first three levels (0%, 1-15%, 16-25%), but the others should be easy to add following the same pattern.


IF({Gross Profit} < .01, "0%",
IF({Gross Profit} <= .15, "1-15%",
IF({Gross Profit} <= .25, "16-25%")))

Exactly what I was needing @Justin_Barrett. I was putting the percents as a percent and not decimal. Thanks for the example.


Reply