
Hi,


I’m looking for a formula that can help me understand my “task capacity” for the day. In other words, let’s say I have “estimated time required” set for all tasks for that day, and that equals 7 hours… how can I then:


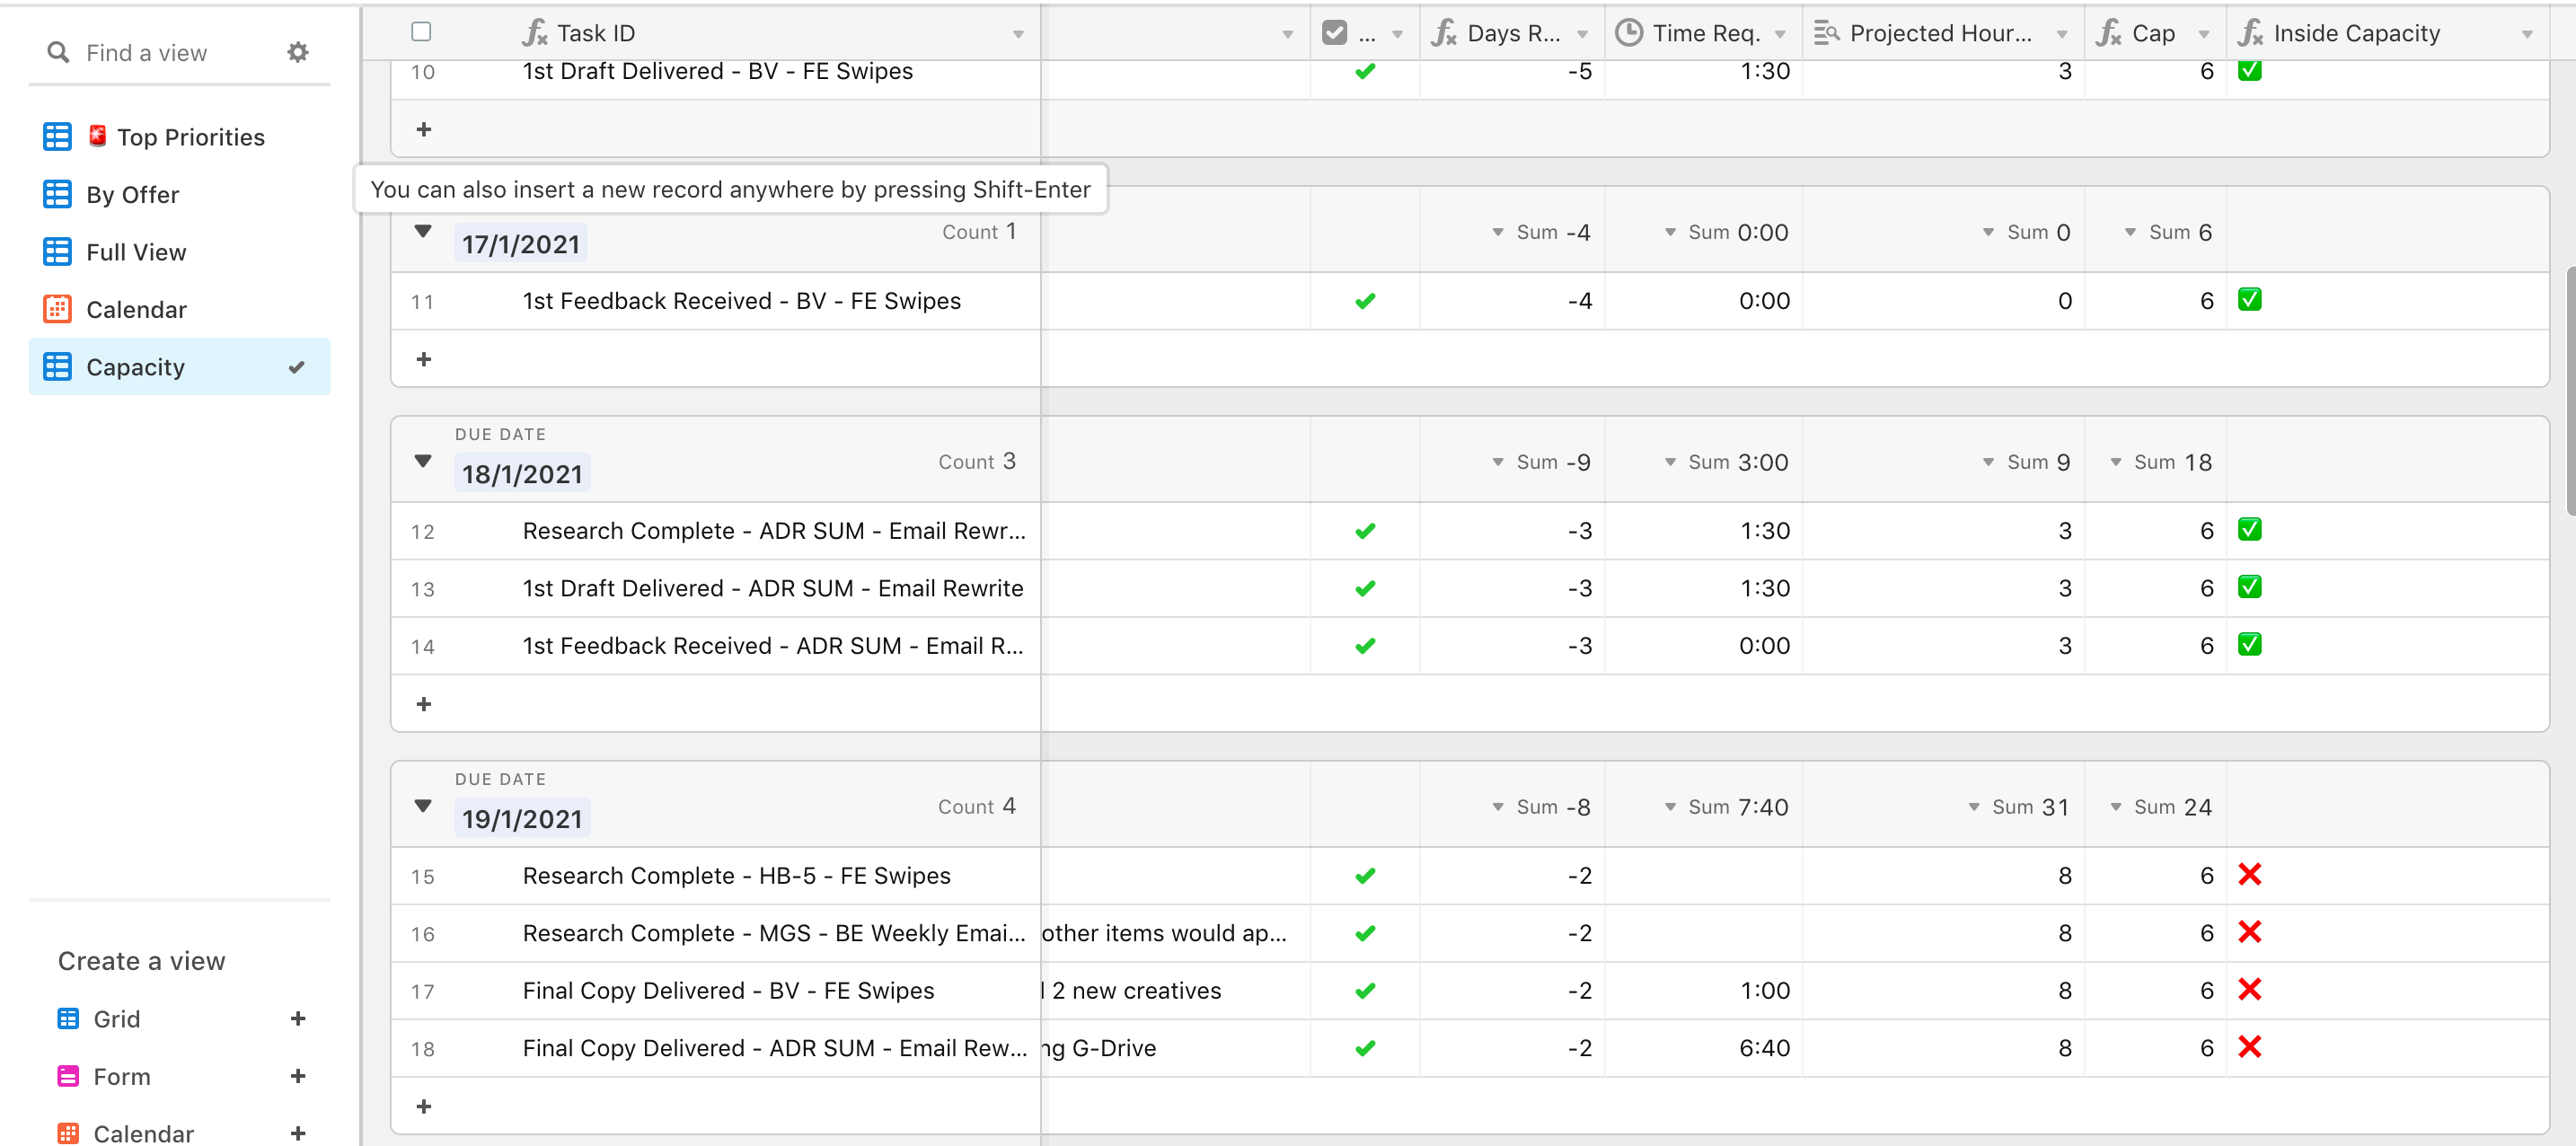
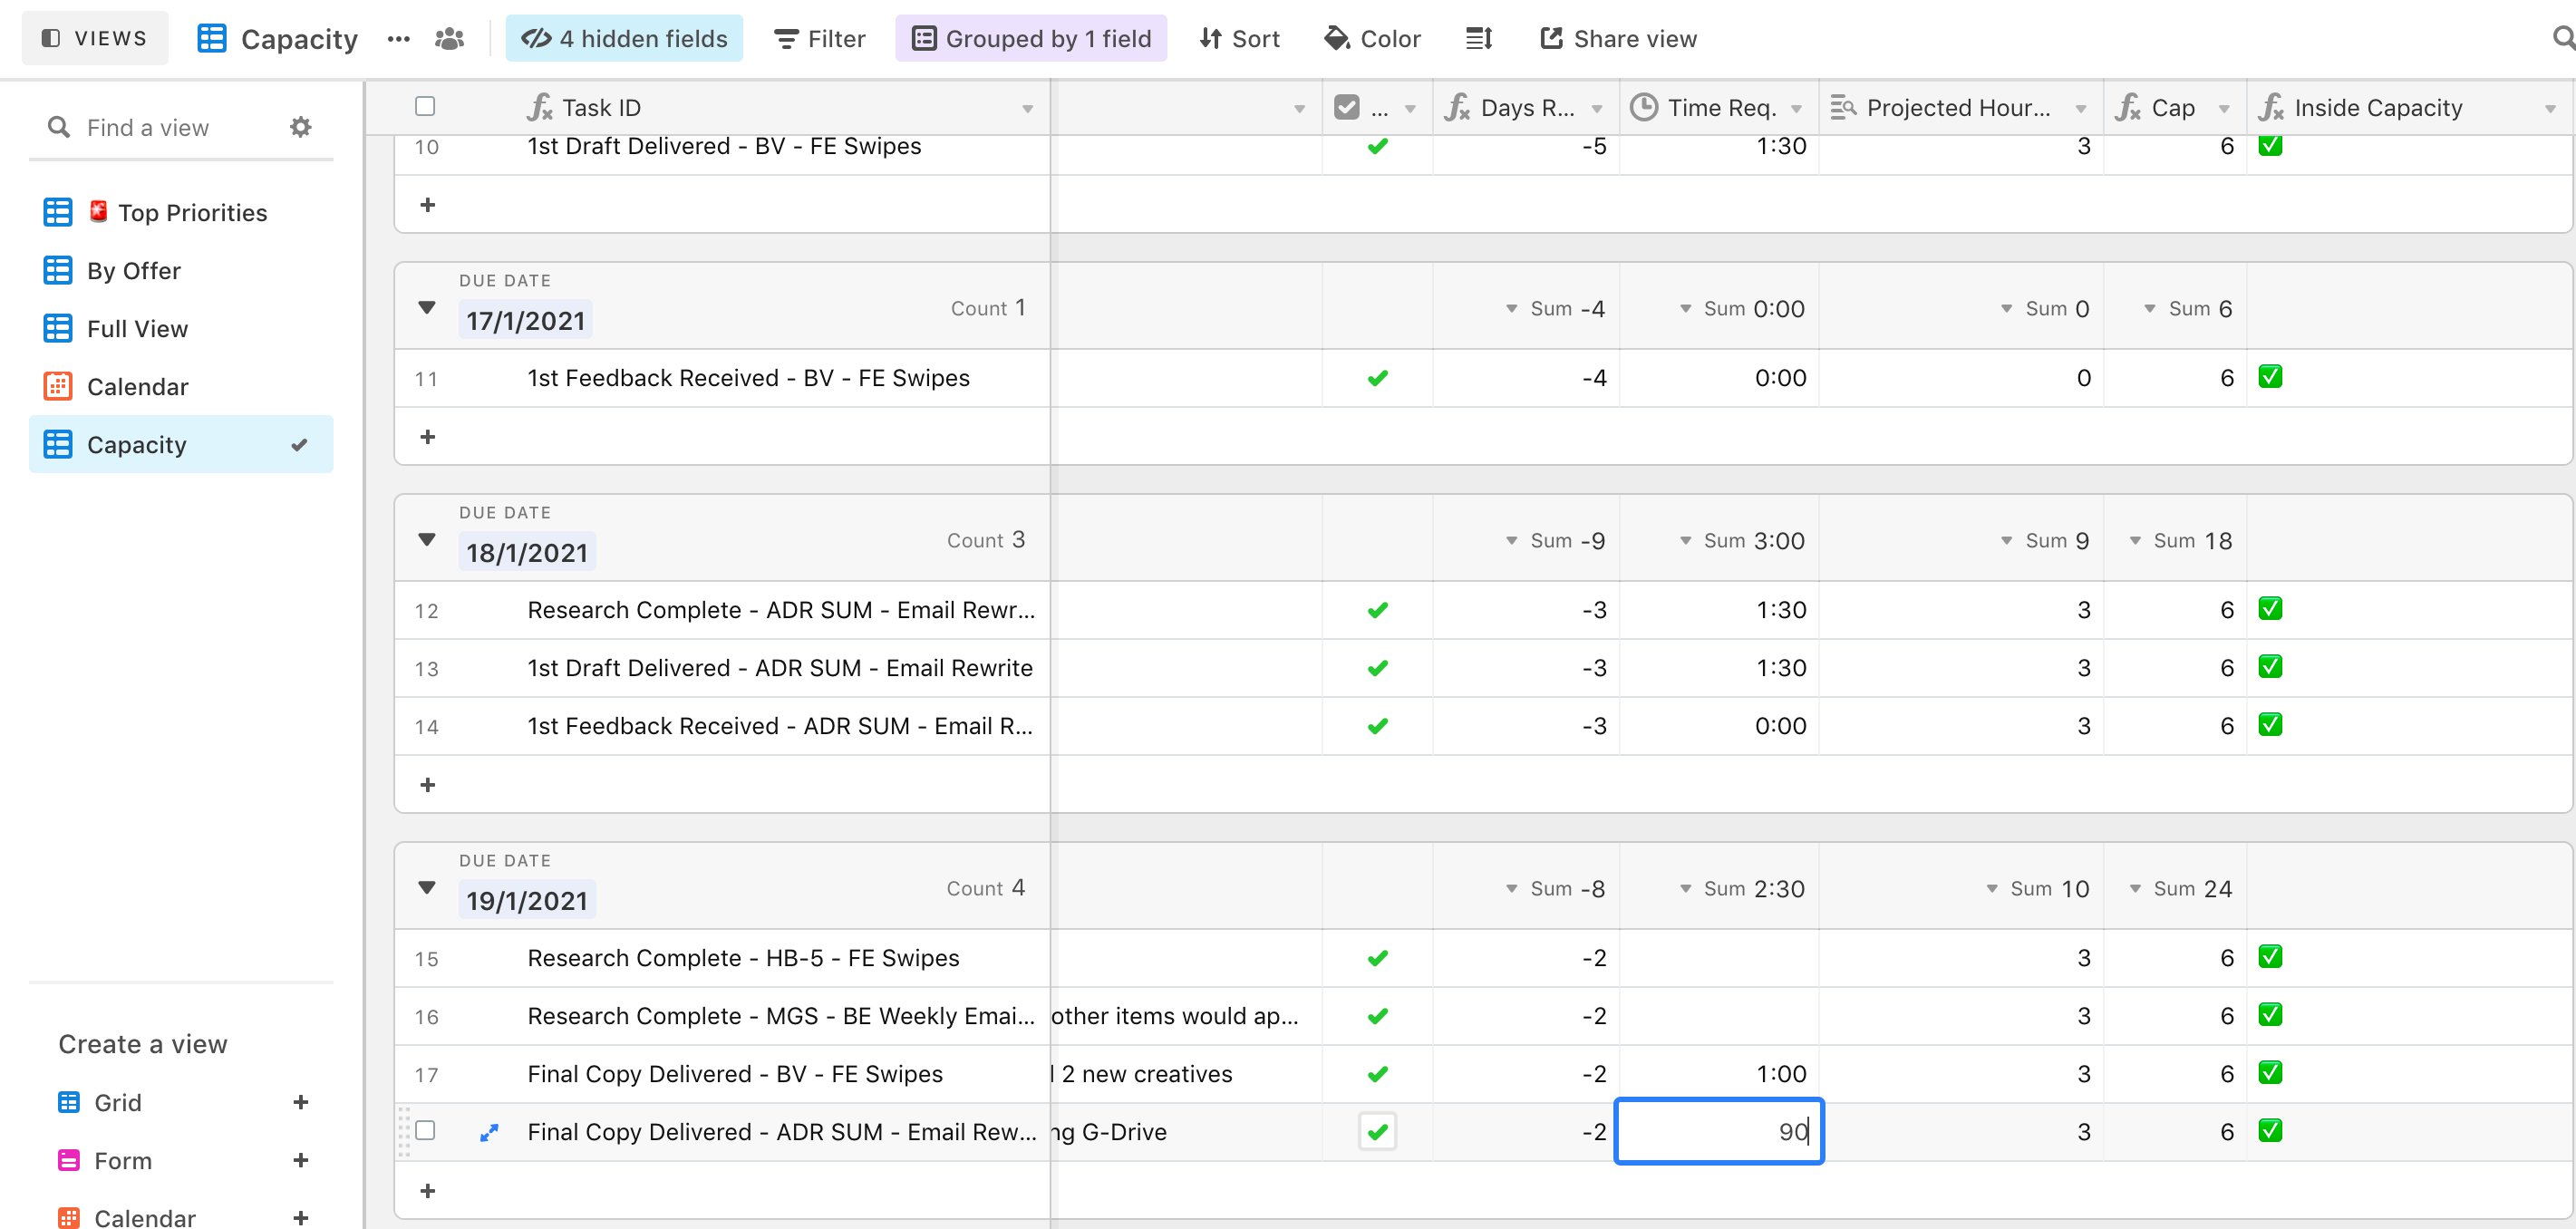
a) First create a formula or setting to tell Airtable my capacity for the day is 8 hours, and…

b) How can I then create a formula that takes that day’s tasks and lets me know if I’m over or under capacity?


An example…


If my max was set to 8 hours for the day, and I have 7 hours of tasks, AT would tell me I’m in the green (Green check symbol). If I have 9 hours of projected tasks, AT would tell me I’m over capacity (Red cross symbol)?


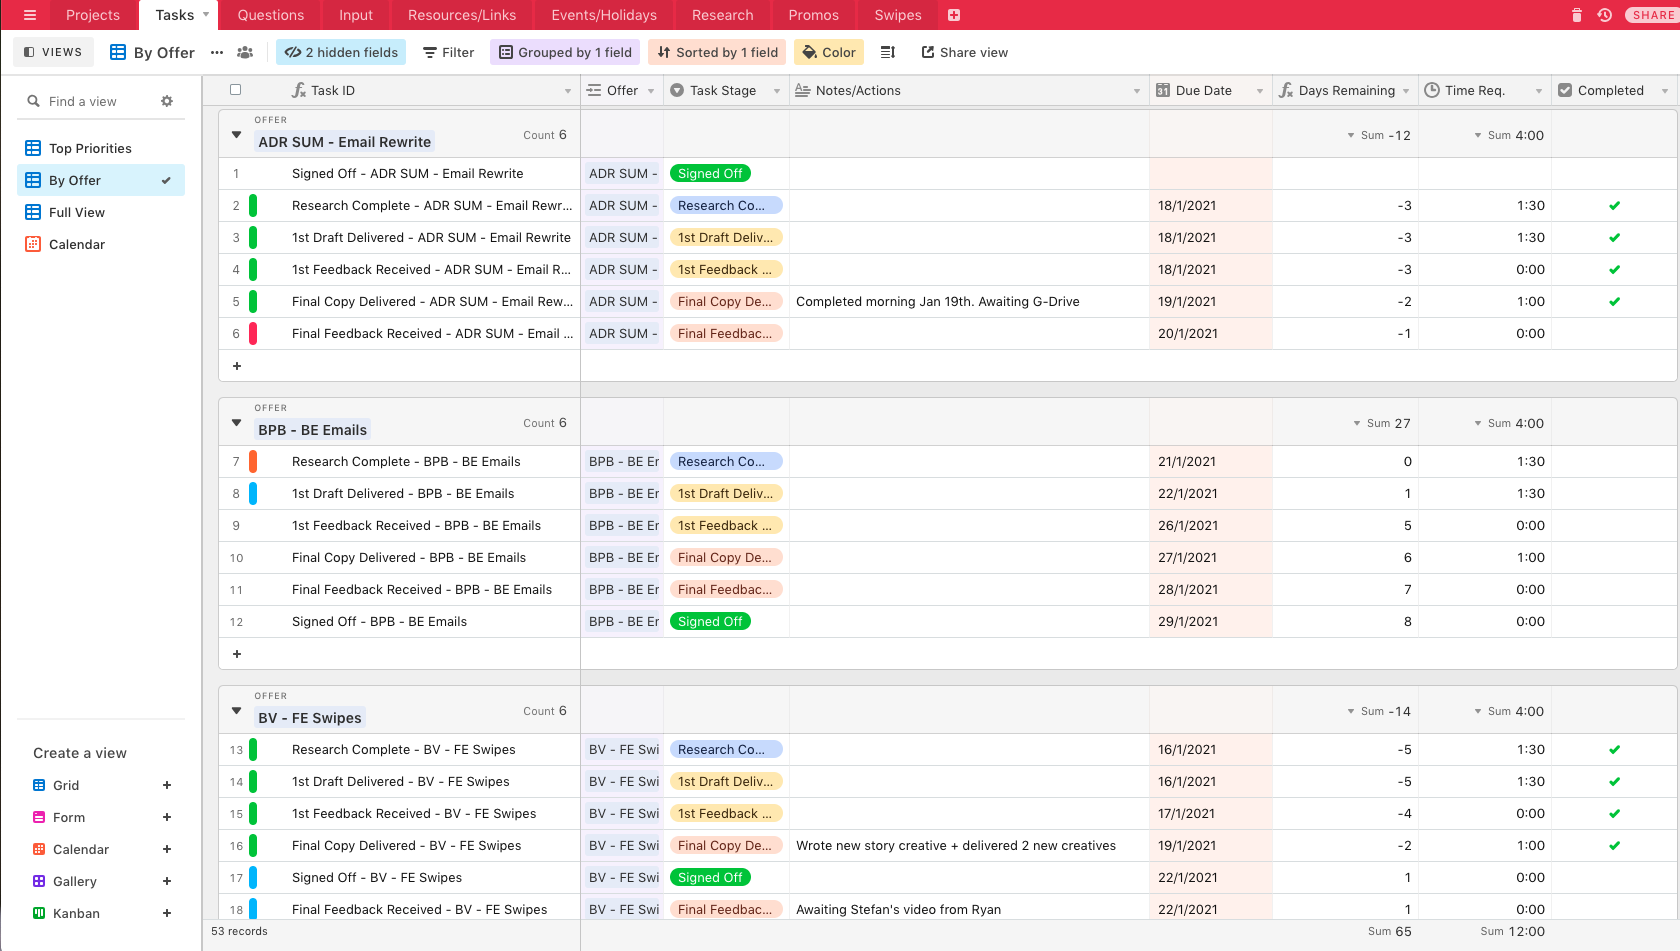
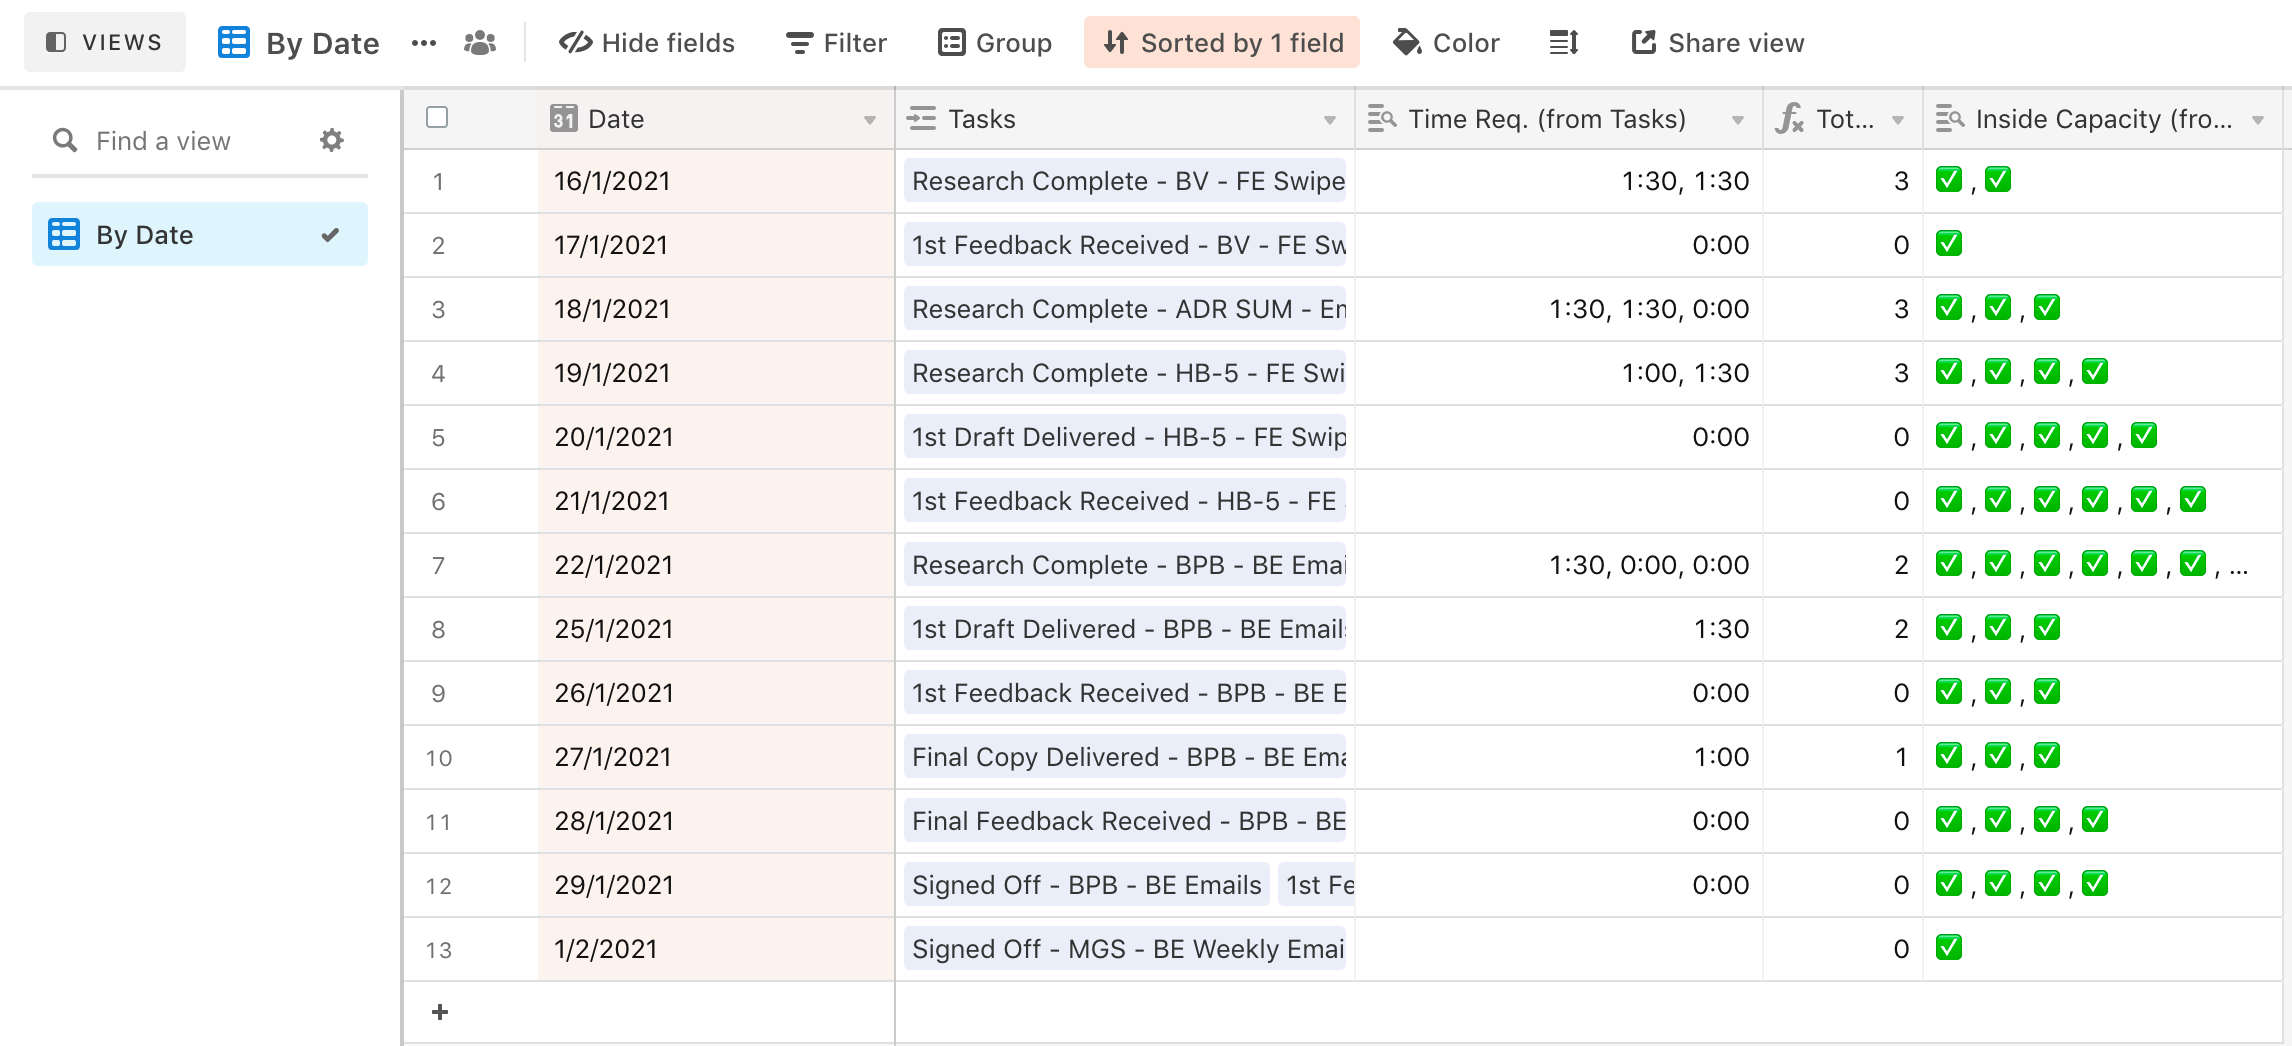
I’ve attached a screenshot of my current “Tasks” view inside my own project manager, in case it’s of help. Thanks in advance for any assistance! -Christopher


@Torus_Global How are you marking the tasks that are going to be done today? I only see a due date on your table.


@Torus_Global How are you marking the tasks that are going to be done today? I only see a due date on your table.


The due date and the color coding on the left. Orange is for “needs to be done today”, Red is “overdue” and blue means “needs to be done within 48 hours”. Once the task is checked, it switches to green.


The due date and the color coding on the left. Orange is for “needs to be done today”, Red is “overdue” and blue means “needs to be done within 48 hours”. Once the task is checked, it switches to green.


I’m just trying to get information thats needed. So the Orange “Needs to be done today” is all of the tasks with the due date equaling today?


I’m just trying to get information thats needed. So the Orange “Needs to be done today” is all of the tasks with the due date equaling today?


Sure, np. Here’s a screenshot that might help


Sure, np. Here’s a screenshot that might help


@Torus_Global I think I figured it out. Check out the link. It’s a loom video so you can see what I did.


@Torus_Global I think I figured it out. Check out the link. It’s a loom video so you can see what I did.


@Andrew_Wright - thank you for recording this for me. I’m digging into this tonight and will let you know if I have any questions. Appreciate it. -Christopher


@Andrew_Wright - thank you for recording this for me. I’m digging into this tonight and will let you know if I have any questions. Appreciate it. -Christopher


@Andrew_Wright - you’re a champion. Got it.


I created a new View titled “Capacity” inside my Tasks table as well, so I can view that way. First screenshot below is with day “over” capacity, hence the Red X…


Second screenshot is with day “under” capacity, Green check…


Third screenshot is the second new table, titled “Capacity”…


Thanks again, Andrew. Really appreciate your help.


-Christopher


@Torus_Global No problem, happy to help. Mark this as solved on my video! Good luck with future projects. @ me if you have any questions


Reply