
Hi there smart people!

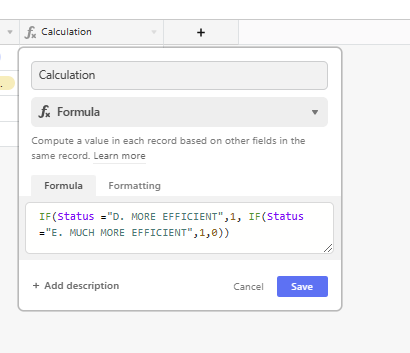
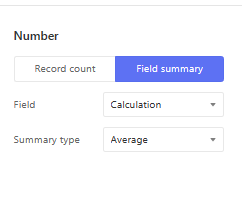
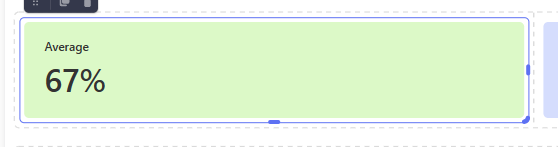
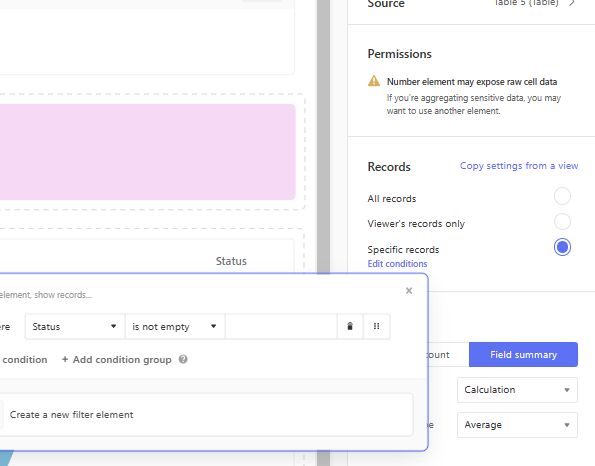
I'm looking to show the percentage of improvement since the implementation of our new Figma redlining process from our team survey. Right now, 5/8 people say the process has either improved or greatly improved! Is it possible to show this in Airtable's Interface? Either as 5/8 or 63%? Participants will continue to add to this survey in the coming weeks. So, I need a create a formula that will update the Interface accordingly. 

Please, let me know if anyone has an answer!

one way is to create a formula which creates a 1 if your condition (improved or greatly improved) is fulfilled and 0 if not.

then create a number element which you set to this field and then make the summary type average


one way is to create a formula which creates a 1 if your condition (improved or greatly improved) is fulfilled and 0 if not.

then create a number element which you set to this field and then make the summary type average


Thanks so much! Can you let me know what those formulas would be?


FORMULA 


AND THEN NUMBER 


IF YOU HAVE BLANK RECORDS THEN YOU NEED TO FILTER THESE OUT AT THE NUMBER PHASE TO EXCLUDE ANY WHICH HAVE NOT GOT A RESPONSE TO THE QUESTION 


Thank you! This is magic!!


Reply