What's up guys,
I'm struggling to implement Vega-Lite chart extension on my base, it's my first time using it.
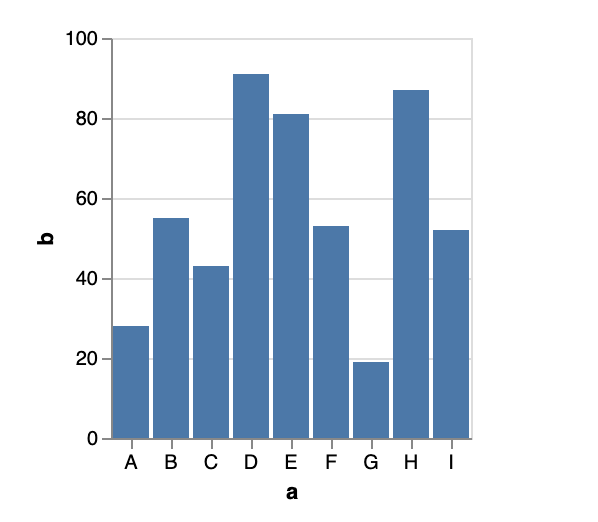
I'll show you an example of the base I'm working on in which I'll need to create a bar chart. It seems that I can't add multiple fields on the x axis.
If anyone can help it'd be greatly appreciated.