Hi,
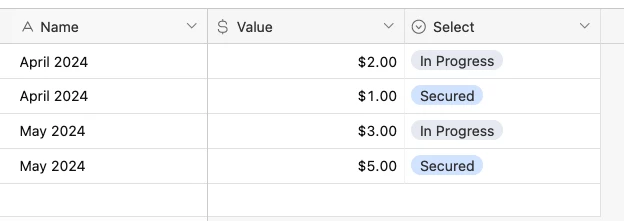
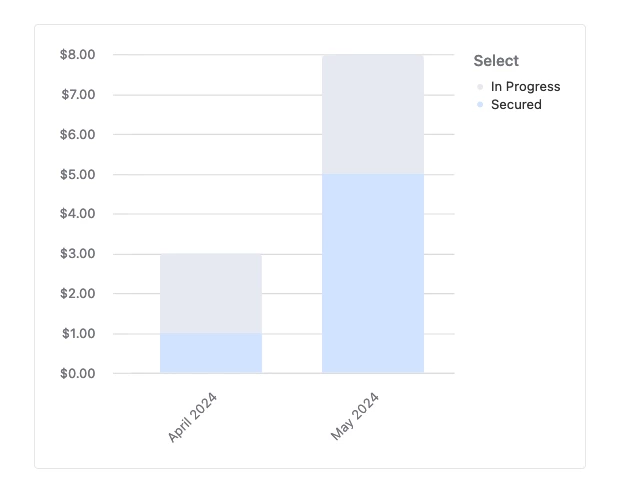
I'm using AirTable to track potential sales opportunities and would like to visualise on a chart the revenue per month. This is similar to the Gantt chart view but instead would show the size of revenue rather than simply a project.
For example, if an opportunity lands on the 15th April that will last 2 months, completing on the 15th June and worth £100k, this would be spread over those months. I.e. £50k in April, £100k in May, and £50k in June. Then a bar chart would total all these by month.
In Excel this is relatively easy - you create a column for each month that calculates how much of the revenue in each month (can just about do that here but it's not easy). Then you create a bar chart for the table and it shows it easily. Can't find a way to do that in AirTable or with an app.
Any and all help is much appreciated!!
Dan