hello,
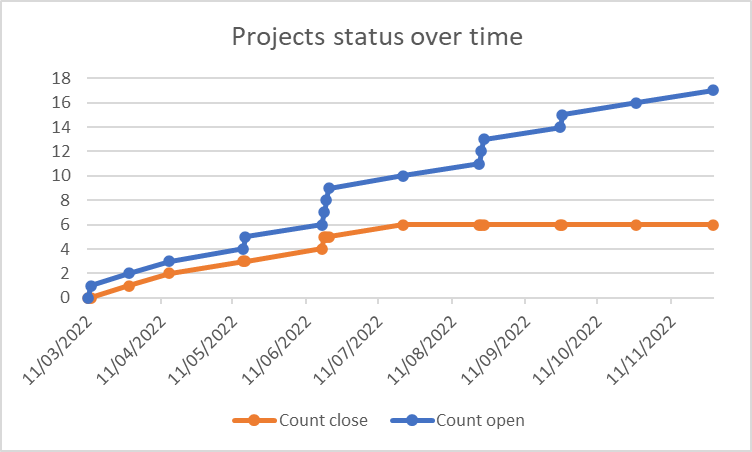
I have a project tracking tool in airtable and am trying to track project status over time. basically a cumulative chart of projects open and closed over time, something similar to this:

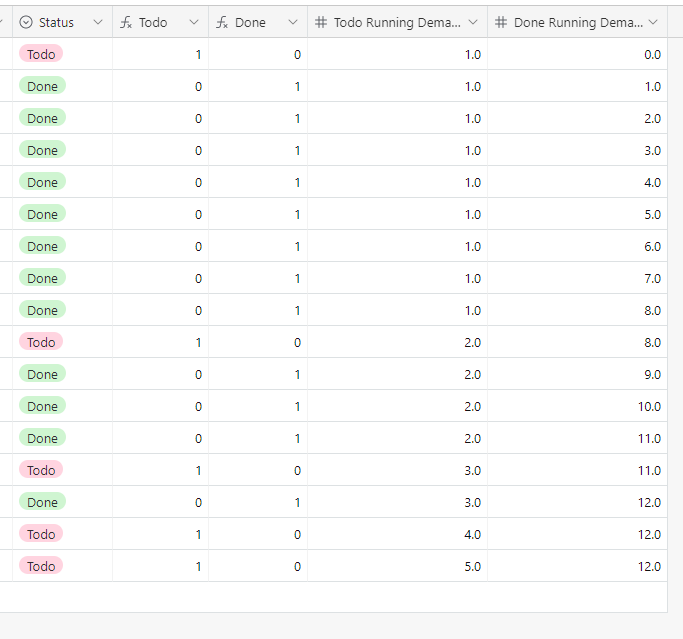
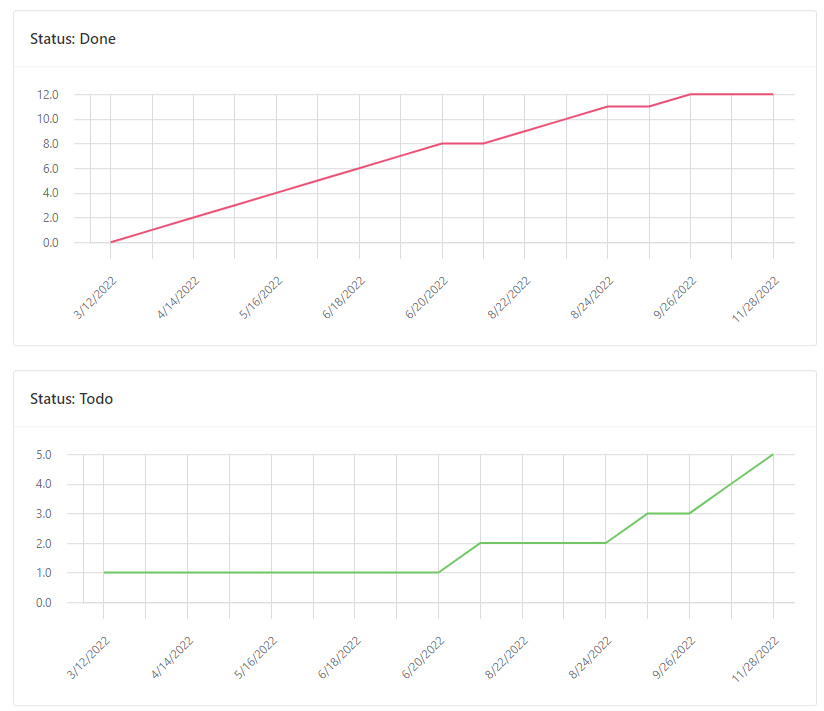
Basically, I need a collum with time another with running totals for open projects, and another for closed projects, and then chart these. Ideally, I would love to have this in an interface chart.
is there a way to achieve this, I have seen similar questions but so far I have not seen a straightforward answer.


