
Hi Everyone.  I have a reseller company selling my products.   I need to pay them rebates every month.

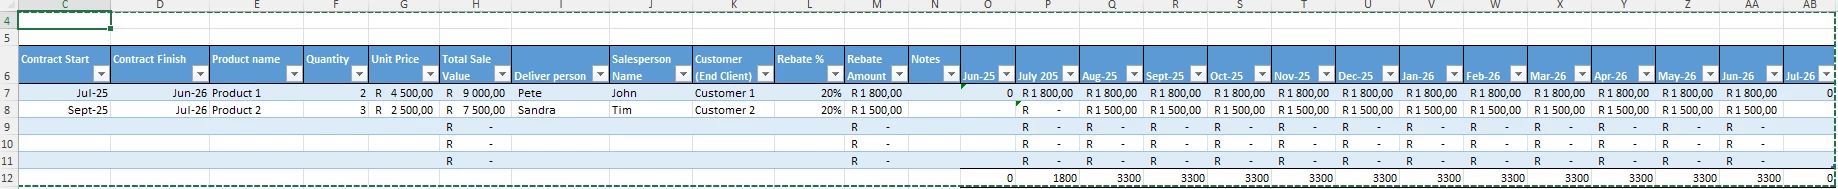
I have drawn up a table to track sales as they are made.  It will then also pull through the rebate amount to each month’s column based on the contract start and finish date.

I now want to create a dashboard that the reseller and I can view every month to see the total amount of resales for the month.  IE. I want a chart showing each month’s total rebate.  

I would also like to setup seperate dashboards showing for example the number of active contracts, how much rebate is owed to each different sales person, etc….

Can anyone please assist/guide me with this on how to get the information into a dashboard.  I have created the dashboard similar to this excel file but Just not sure how to pull over the data for insights as I am struggling to get all the months into one chart.


I want a chart showing each month’s total rebate.  

Hm, for a display only thing, you could try creating a chart in an Interface, put the date on the X axis, then bucket it by the month?  

If not, your best bet's to create a new table where each record represents a month year and link each month’s sales to the appropriate record, and you can do this with an automation.  The idea is to create a formula field that’ll output the month year value (e.g. June 2025), and have an automation paste that value into the linked field to that new table

---

I would also like to setup seperate dashboards showing for example the number of active contracts, how much rebate is owed to each different sales person, etc….

Hm, assuming the active contracts are also set to a monthly thing, then the solution above would work for this as well

Or the sales people I think you’d need a new table where each record would represent a single sales person and a single month?  If you don’t need the sales people data by month, then you could just link each sale to the appropriate sales person and rollup the sales from there