I'm really hoping this can be accomplished without needing to create yet another formula field, so I'll give details below and see where I get. 🙂
I have fields for start and end dates and then a formula that calculates the duration between them, including when the end date is blank and then it just keeps counting from the start. I want to have a chart show this data on an interface, but I don't want every single value showing uniquely on the chart if possible.
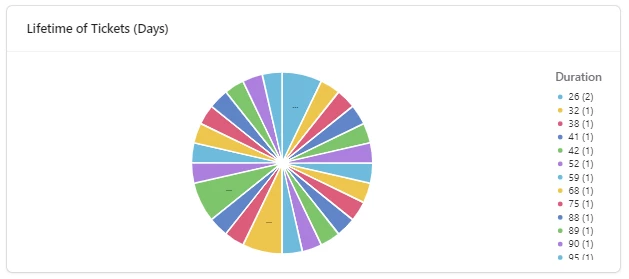
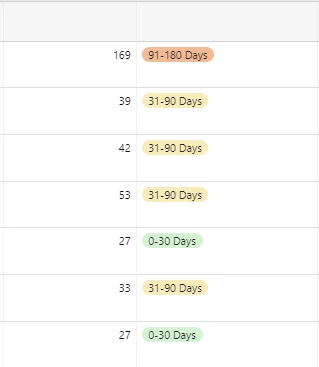
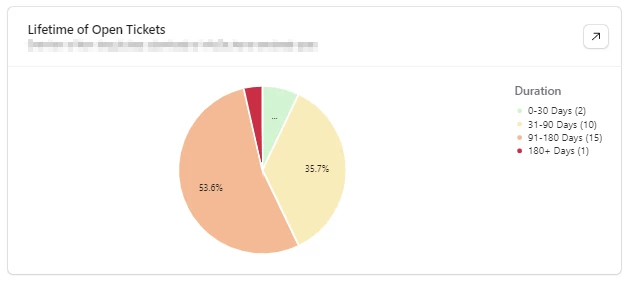
Instead, I'd like to have it group them into buckets for things like 0-30 Days, 31-90 days, 90+ days, but I can't see any way to do that intelligently within the interface. My fear is that I'm going to need a formula field that gathers this at the table level and then point the pie chart to that field instead of the duration field.
Anyone have a suggestion for the best way to accomplish this kind of reporting? Thanks!