

Hello,
Is it possible to combine multiples of identical x-axis values in the interface chart?
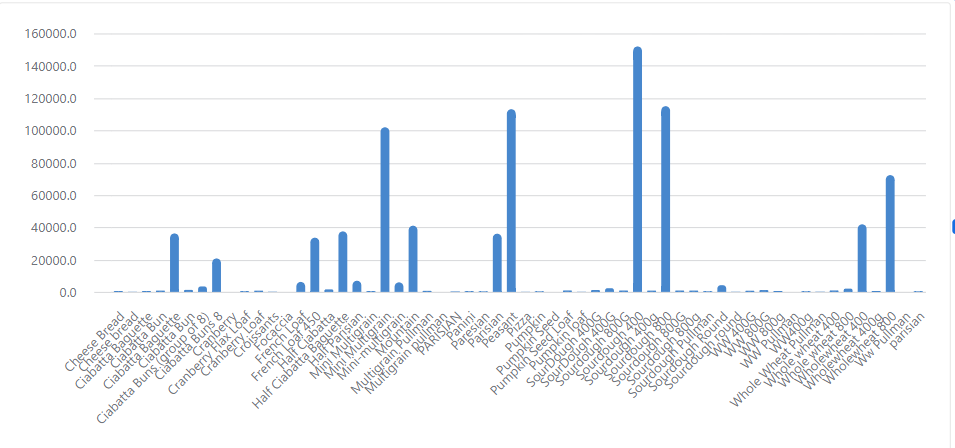
I have multiples of identical x-axis values and I want to combine those values into 1 bar.
I could make a special summary table with a roll-up but then the person using the interface would not be able to filter the records the way they want, so I need the chart to show all the records and be connected to the accessible filter element in the interface.