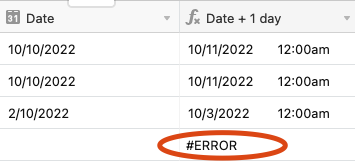
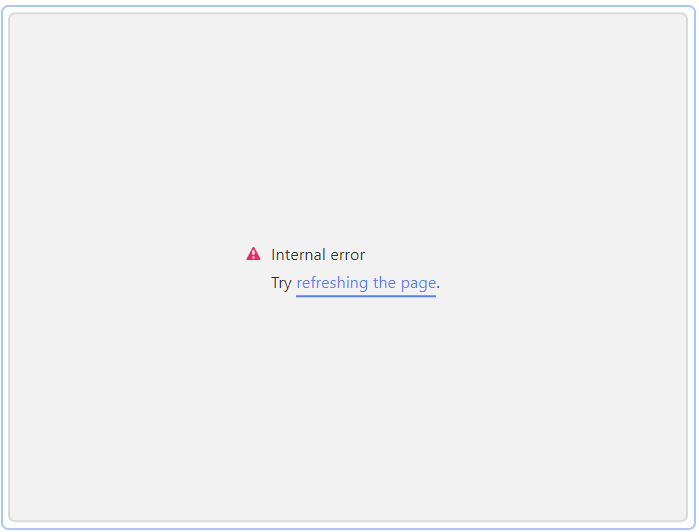
Hi there. I’m trying to create an interface designer graph element that has year on the x-axis. The data I would like to pull from for the x-axis is a formula field formatted as a date, grouped by year. Every time I’ve tried to create an interface designer graph element using a formula field that’s formatted as a date it has collapsed (see below screenshot - refreshing the page does nothing) and also caused all the other graph elements to never populate (perpetual wheel, also see below).

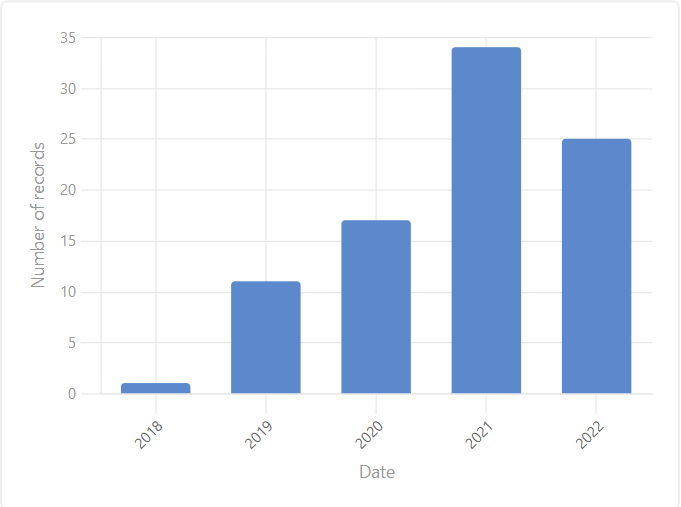
I created a new column in my data that copy and pasted the output data in the formula column, but now in a date field type. I used this date field to as the x-axis data instead and everything worked perfectly (see below). This makes me think something’s wrong with the interface designer graph elements using data from formula fields that are formatted as dates? Help please!