
Hi,

I'm creating an interface where I want to present the development costs for my company. 

Regardless of the applied filters in the top, I want to limit the amount of records presented in a chart to 20. 

If I don't apply any filters, the graph looks like this:

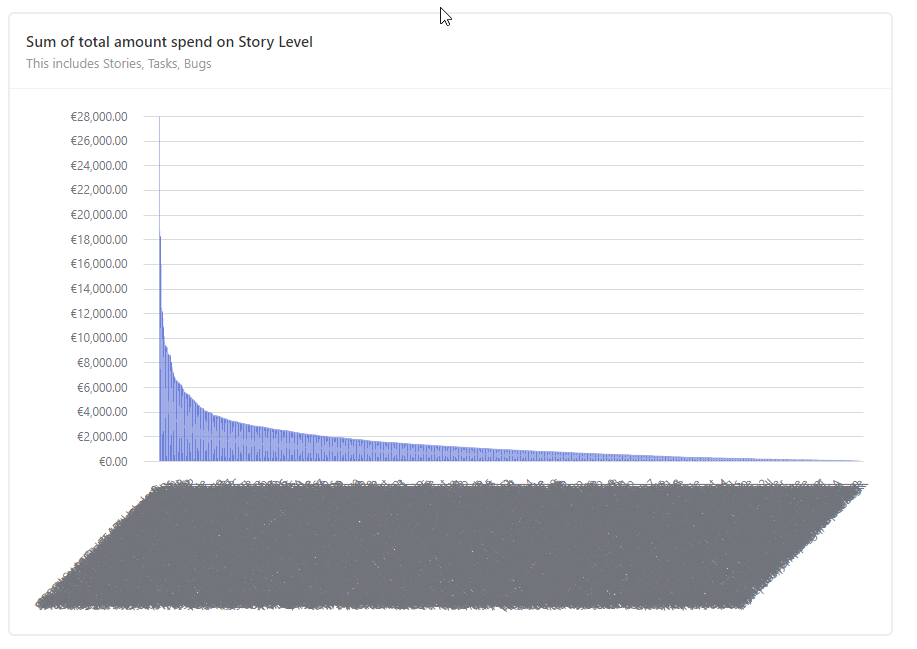
Is there a way to fix this?

Could you create a view with the relevant sort of your top 20, and then base the chart on that particular view?


Could you create a view with the relevant sort of your top 20, and then base the chart on that particular view?


Hi there, I have the same problem as OP and am not sure I follow your proposed solution. Can you please elaborate?

Obviously given the cutoff value I can use a filter to show only the Top 20, but that would require me to update the chart configuration each time I use my interface (since the underlying data is constantly changing). I was hoping to find a solution that allows me to configure the chart to always show only the Top 20 regardless.


Hi all,

I think @eduardo11  summarize my problem perfectly, and the proposed solutions won't fit.


Reply