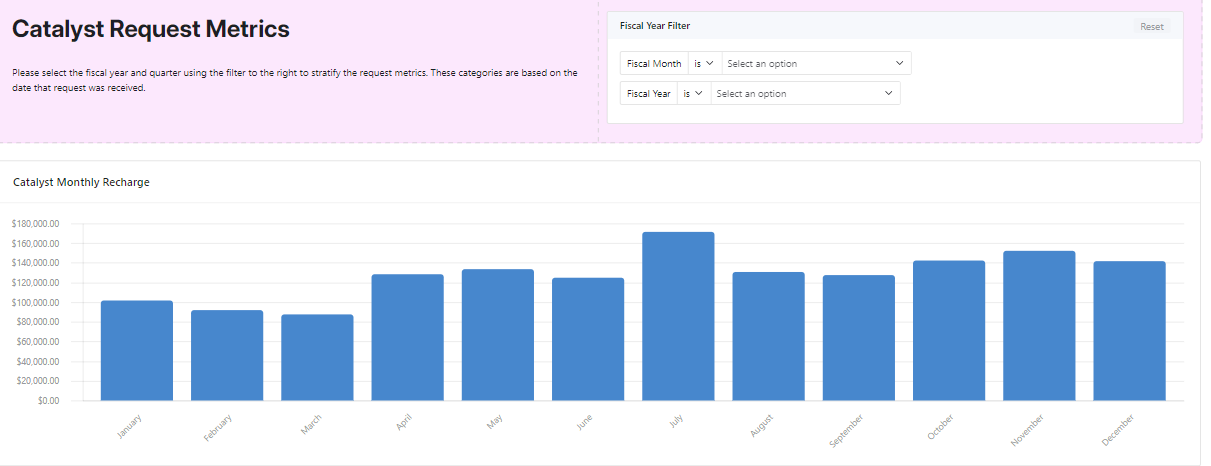
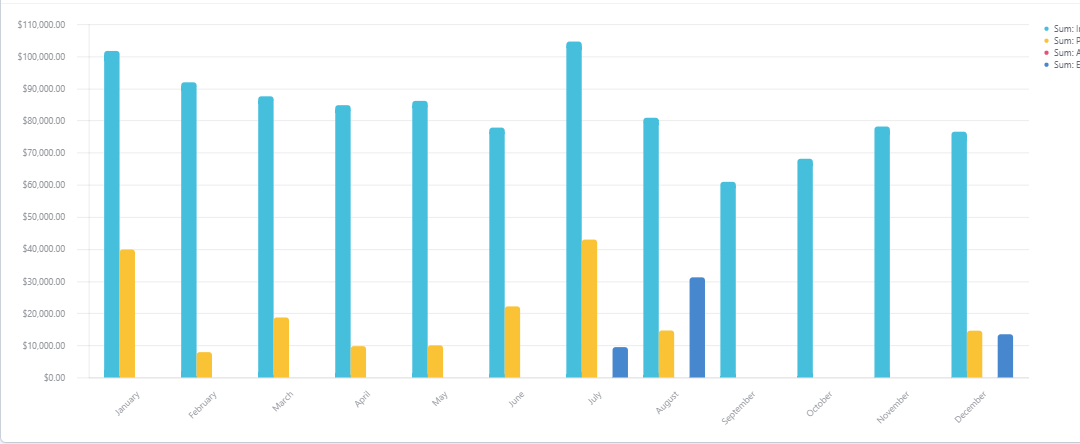
Trying to get my dashboard interface to show a graph with multiple Y axis that links to a record picker. So far, I've only been able to get 1 Y axis, I can get multiple Y axis when I don't use a record picker though.

 +4
+4Trying to get my dashboard interface to show a graph with multiple Y axis that links to a record picker. So far, I've only been able to get 1 Y axis, I can get multiple Y axis when I don't use a record picker though.
Enter your E-mail address. We'll send you an e-mail with instructions to reset your password.
