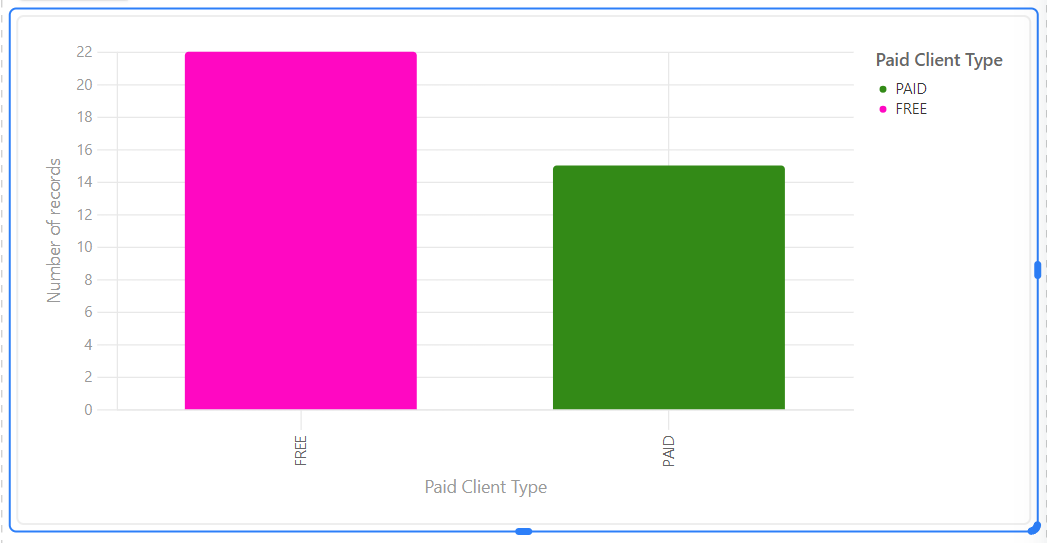
here you can see a simple graph that shows the data fed from the Paid Client Type field and just shows the X-axis value. I’m not sure if I have to build a couple fields to give me a total percentage of the records or not.
I’d like to be able to display what the percentage of these totals are.

Percentage display of Free to Paid
 +20
+20This topic has been closed for replies.
Enter your E-mail address. We'll send you an e-mail with instructions to reset your password.