Hi all, not sure if I’m doing something wrong here or if it’s a bug…
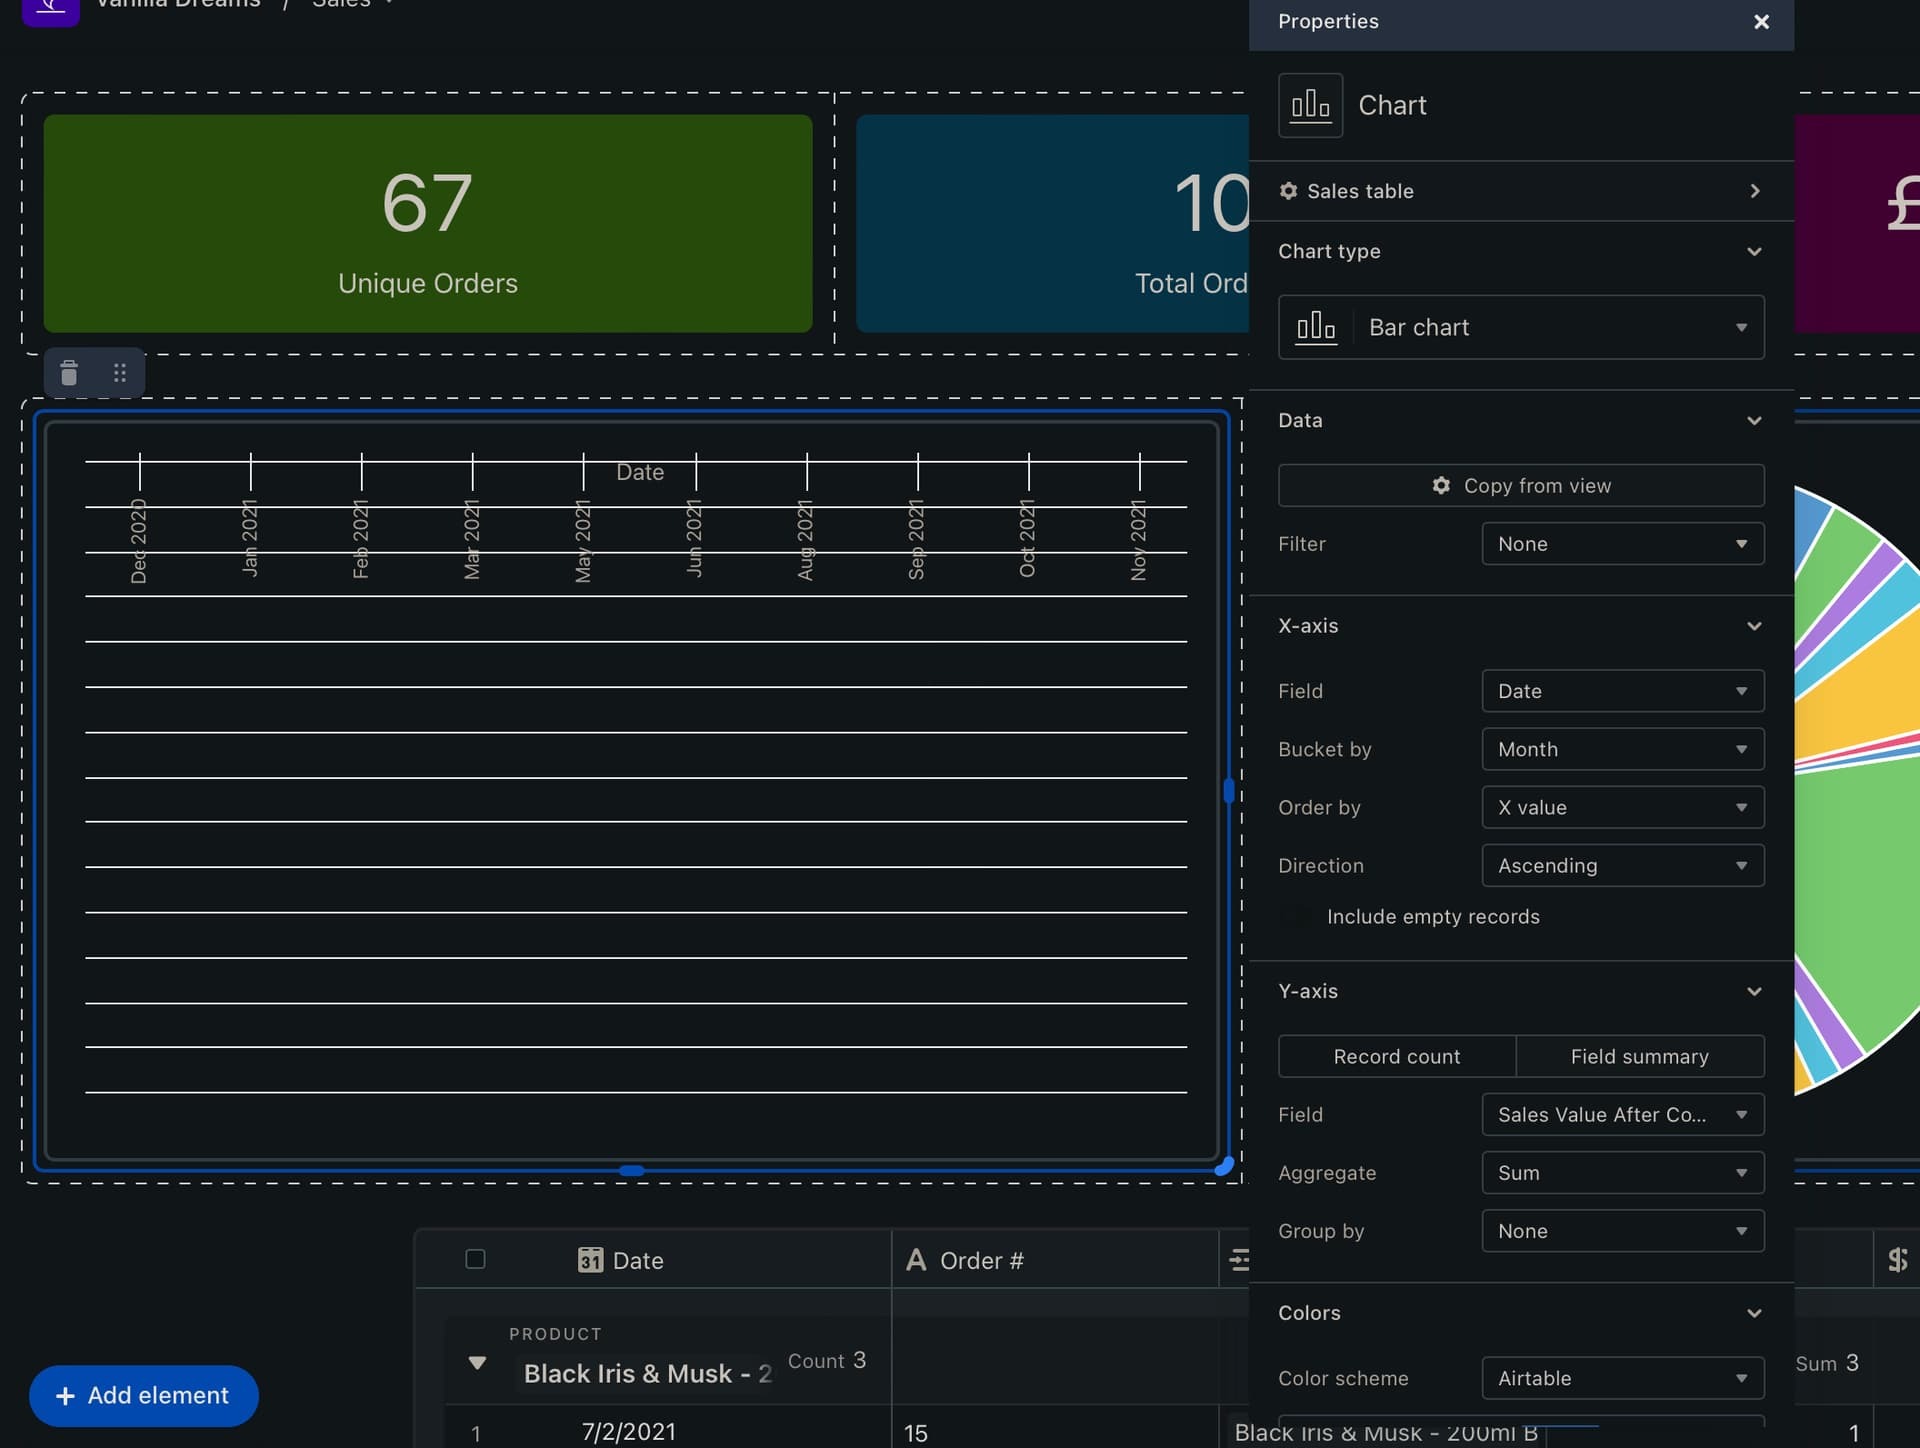
I have a base table with a list of sales orders and I’m trying to create a chart in my interface summing up all sales in monthly buckets.
Initially creating the chart defaults to counting records and I get a bar chart as you would expect. BUT when I switch to SUM by the field containing my sales values I get a blank graph.
Do my settings look right? Am I doing something right or could this be a bug?