Solved

Ratio in interface

  • March 5, 2024
  • 2 replies
  • 60 views

Forum|alt.badge.img+4

How can I display a ratio between two values in interface (dashboard)?

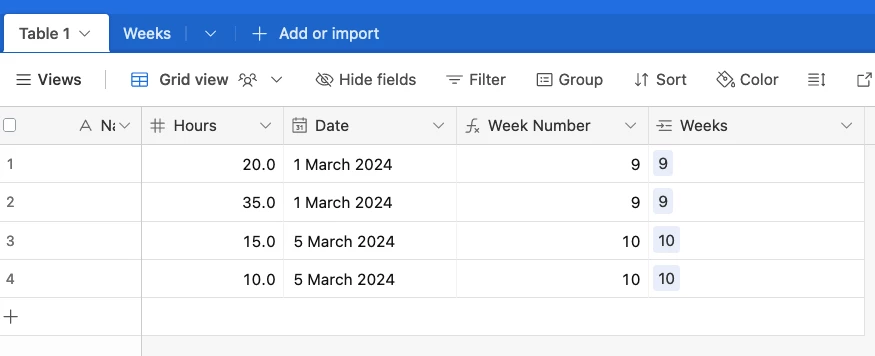
I have the field "hours" in a base.
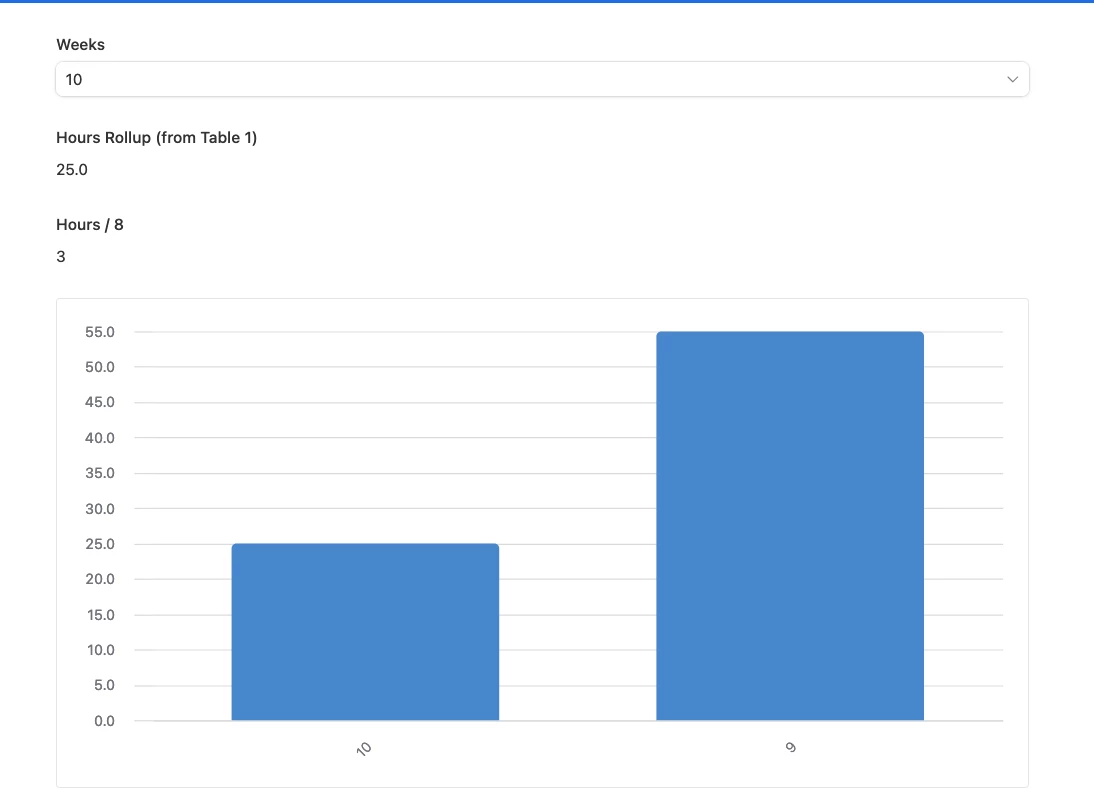
In the dashboard I want to display the number of hours last week divided in a static number.

Like:
All records from last week.
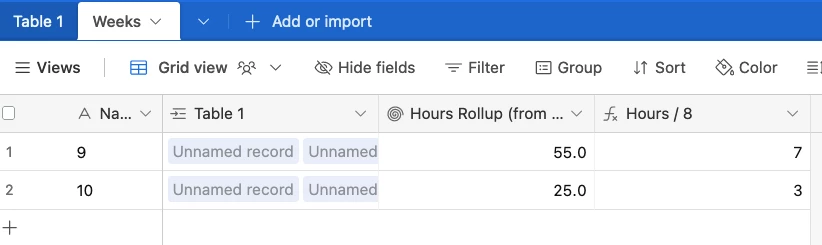
Total amount of hours from those records.
Divided in 8.
Plot this on a chart so I can see progress over time.


I'm OK to go through a new table in the base to solve the problem

Best answer by TheTimeSavingCo

Does this look about right to you?

Link to base

If so, the idea is to use a formula field to "group" the records, and in the example above I grouped it by the week number of the year.  (You'd probably want to use the week number of the year + the actual year, so "10 2024" or something, or maybe something more human readable like a start date to end date?)

Then use an automation to paste the value from that field into a linked field to another table, then you can use a rollup to grab the hours from that week and display it like I did in the Interface, does that make sense?

2 replies

TheTimeSavingCo
Forum|alt.badge.img+31

Does this look about right to you?

Link to base

If so, the idea is to use a formula field to "group" the records, and in the example above I grouped it by the week number of the year.  (You'd probably want to use the week number of the year + the actual year, so "10 2024" or something, or maybe something more human readable like a start date to end date?)

Then use an automation to paste the value from that field into a linked field to another table, then you can use a rollup to grab the hours from that week and display it like I did in the Interface, does that make sense?


Forum|alt.badge.img+4
  • Author
  • New Participant
  • June 20, 2024

Thanks