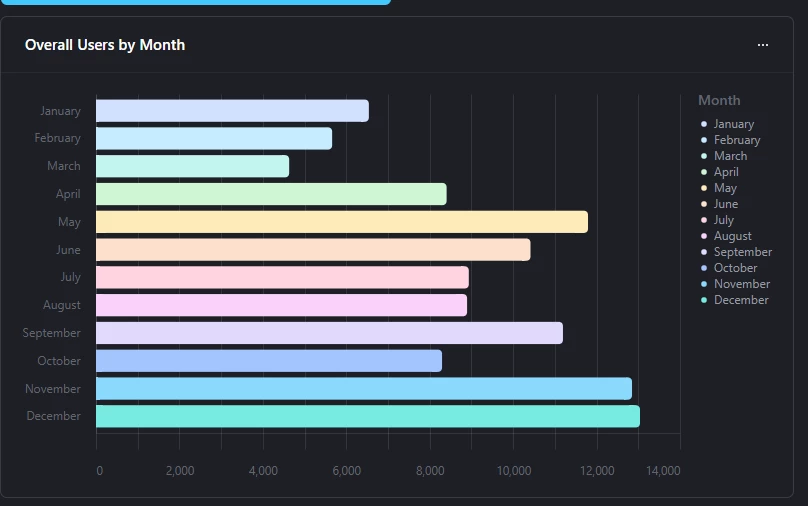
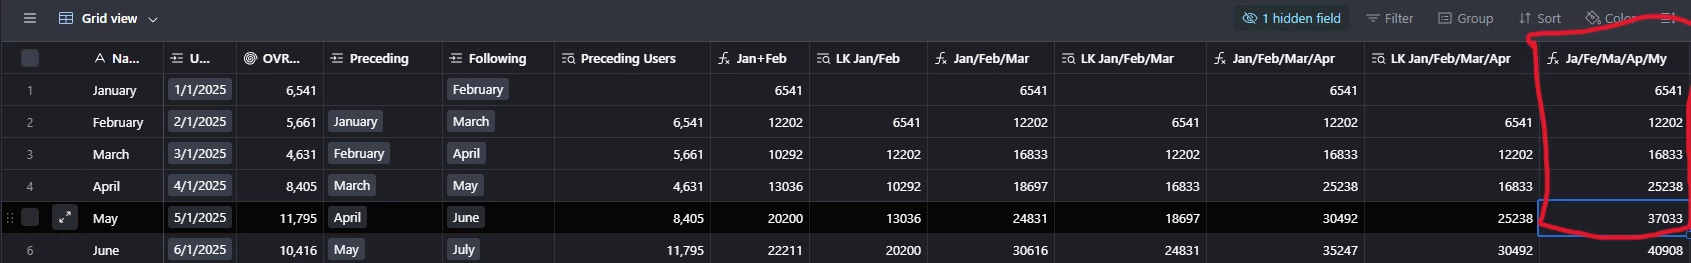
I am trying to figure out how to show growth of a set of records over time, cumulatively. I have created a column in my table that shows the date of when each new record was added, but when I try to graph that in Interfaces, it seems to only let me show to total number of records added in each given month, I can’t figure out how to make a chart that shows the new monthly total added to the previous monthly total to give cumulative growth over the course of the year.
I have found a few previous help questions that were similar, but it seems like no one really got an answer. Is this impossible in Airtable?