Hi,
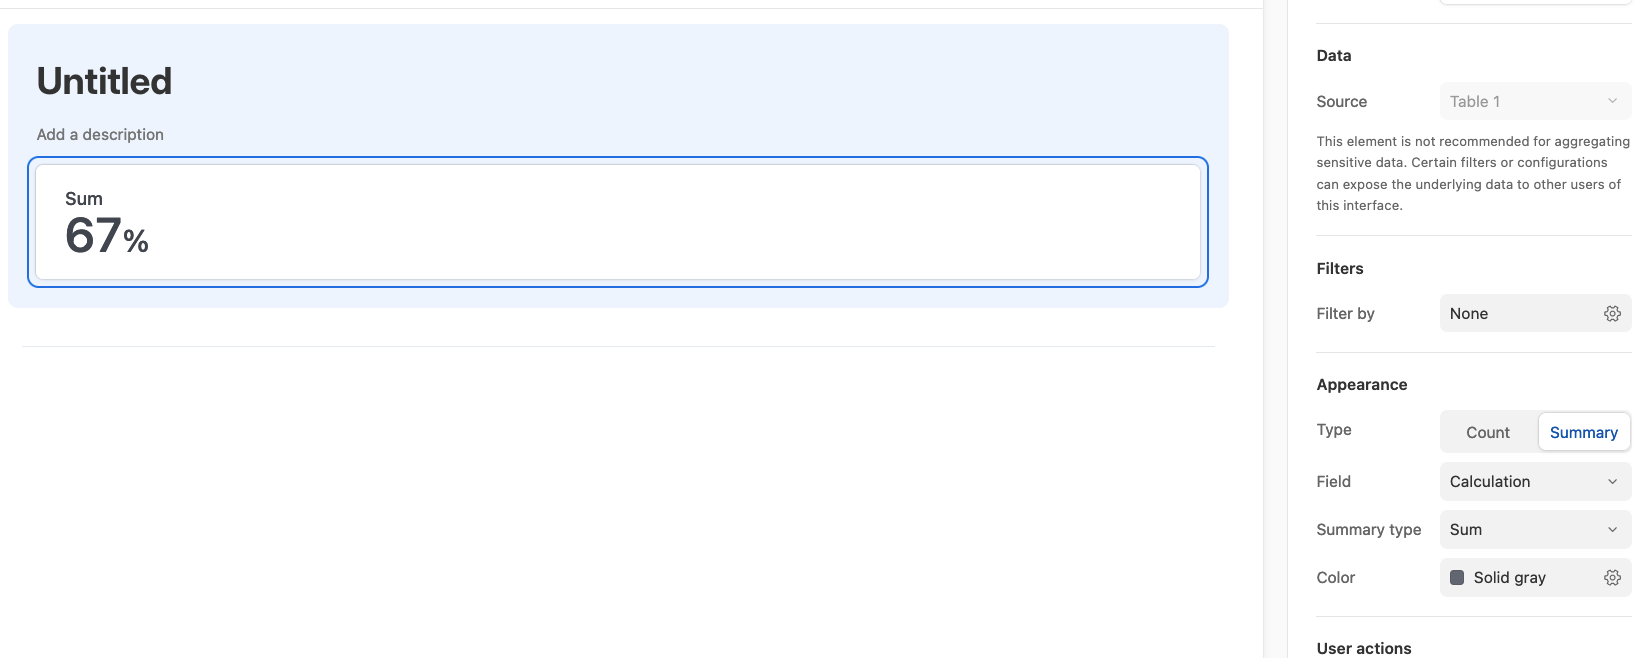
Looking at creating a dashboard for an CRM/ERP application. One key metric to show would be conversion, i.e. percentage of leads that became customers. Since the dashboard "Number" element can only summarise a given column, not perform calculations between columns, I created a new table "BI" to hold various metrics that I will need.
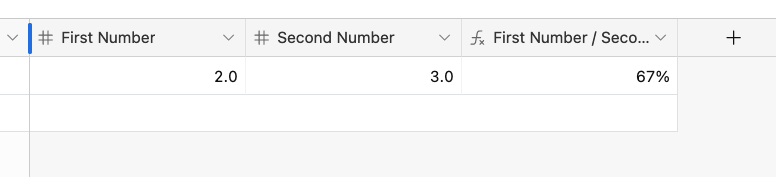
In that table it is easy to link e.g. all contacts and perform rollups and formula calculations to get the needed metric. But then I realised I seemingly cannot place an individual record, say "Overall conversion" (formula: customers / all leads) in the dashboard.
I found that number or graph elements could be used to summarise e.g. yes/no columns which in a way would show the same information, but I'd prefer a simple "Conversion: 42%" instead of a whole graph with all the other, unnecessary information.
How would you go about this?
Rgds,
Björn