Hi!
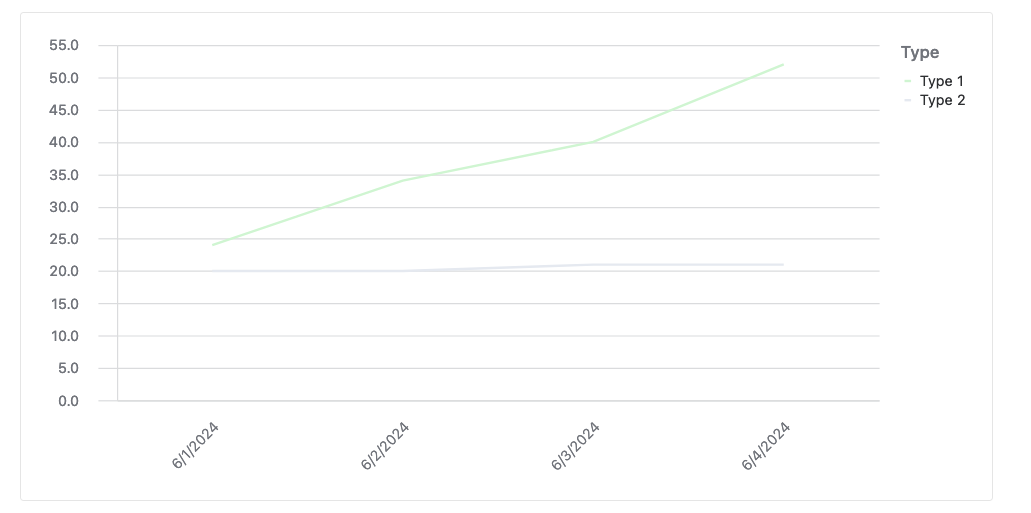
I'm trying to display two lines (series of values) in one line chart.
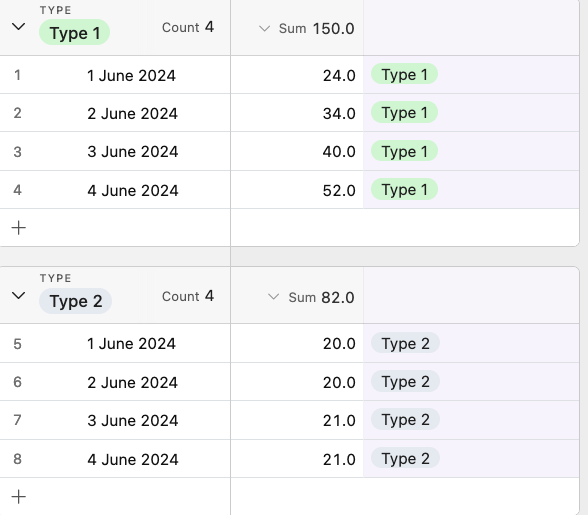
Data goes like:
Date / Value 1 / Value 2
1-1-2024 / 24 / 20
1-1-2024 / 34 / 20
1-2-2024 / 40 / 21
1-3-2024 / 52 / 21
So one line displaying 24,34,40 and 52 and another line in the same chart displaying 20, 20, 21, 21 (for same period (X-axis).
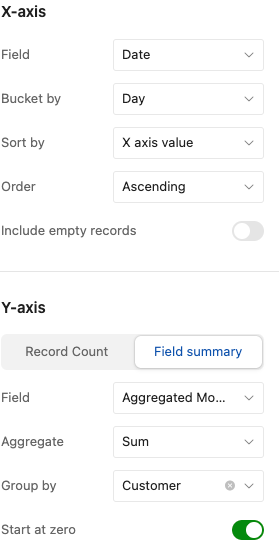
Is this possible in interfaces? Or is there another way to achieve something like this?


