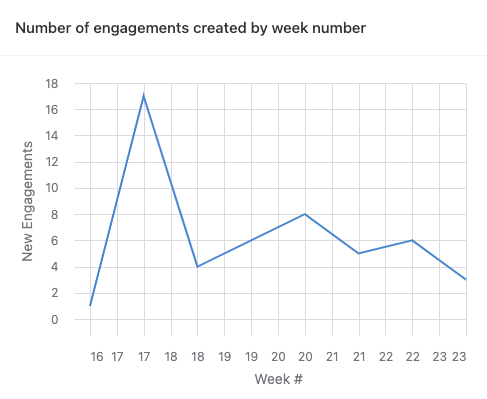
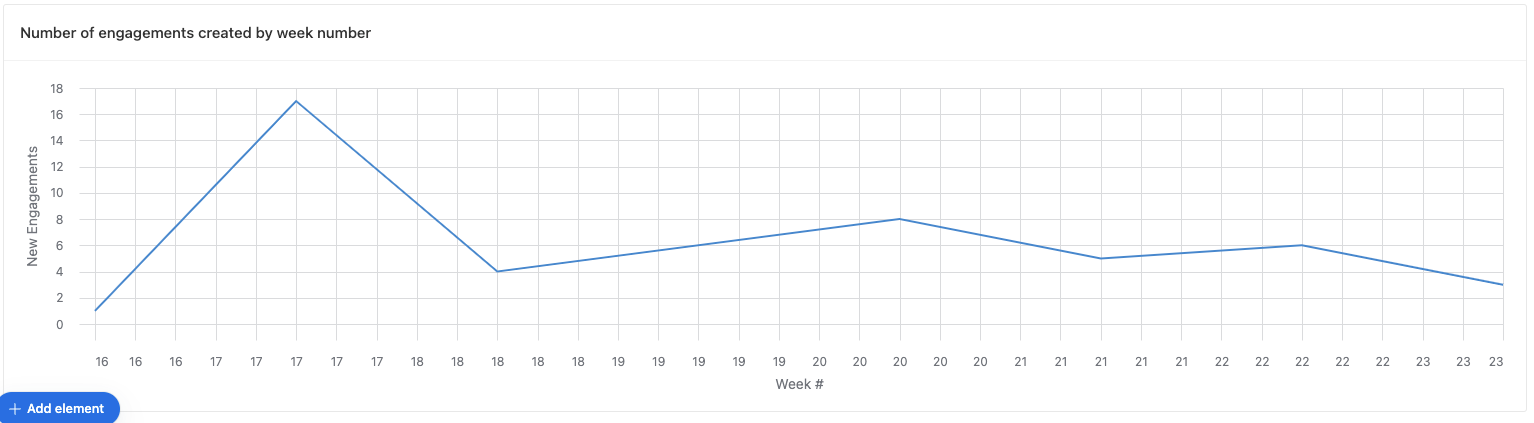
I used a calculation to track the week (in a cal year) that a data point was input into my base so I can track my sales team meeting their weekly quota. When I charted this in the dashboard, multiple weeks (16, 17, 17, 18, 18, etc.) showed up in the chart (pic 1). If I spread out this report in the db, even more weeks show up (pic 2)