

I've been scratching my head to why this is not possible, and I still have a feeling I'm doing something wrong but I can't figure out what.
I have a bunch of time logs that has been logged over multiple years. Every log has an item linked to them which has a rollup that assign every time log into a category based on the item.
My data looks like this:
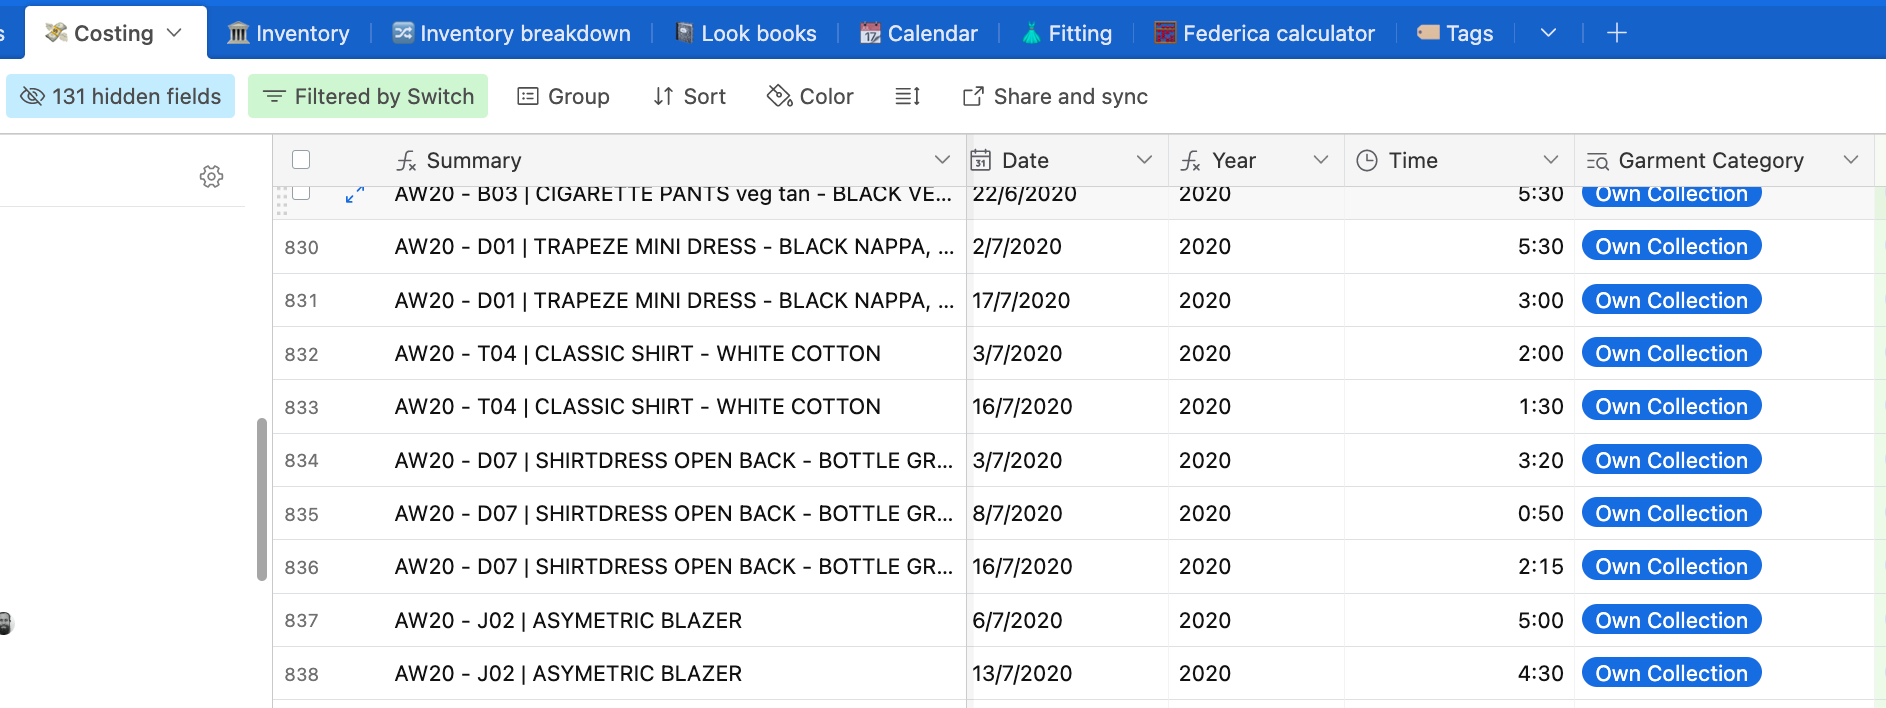
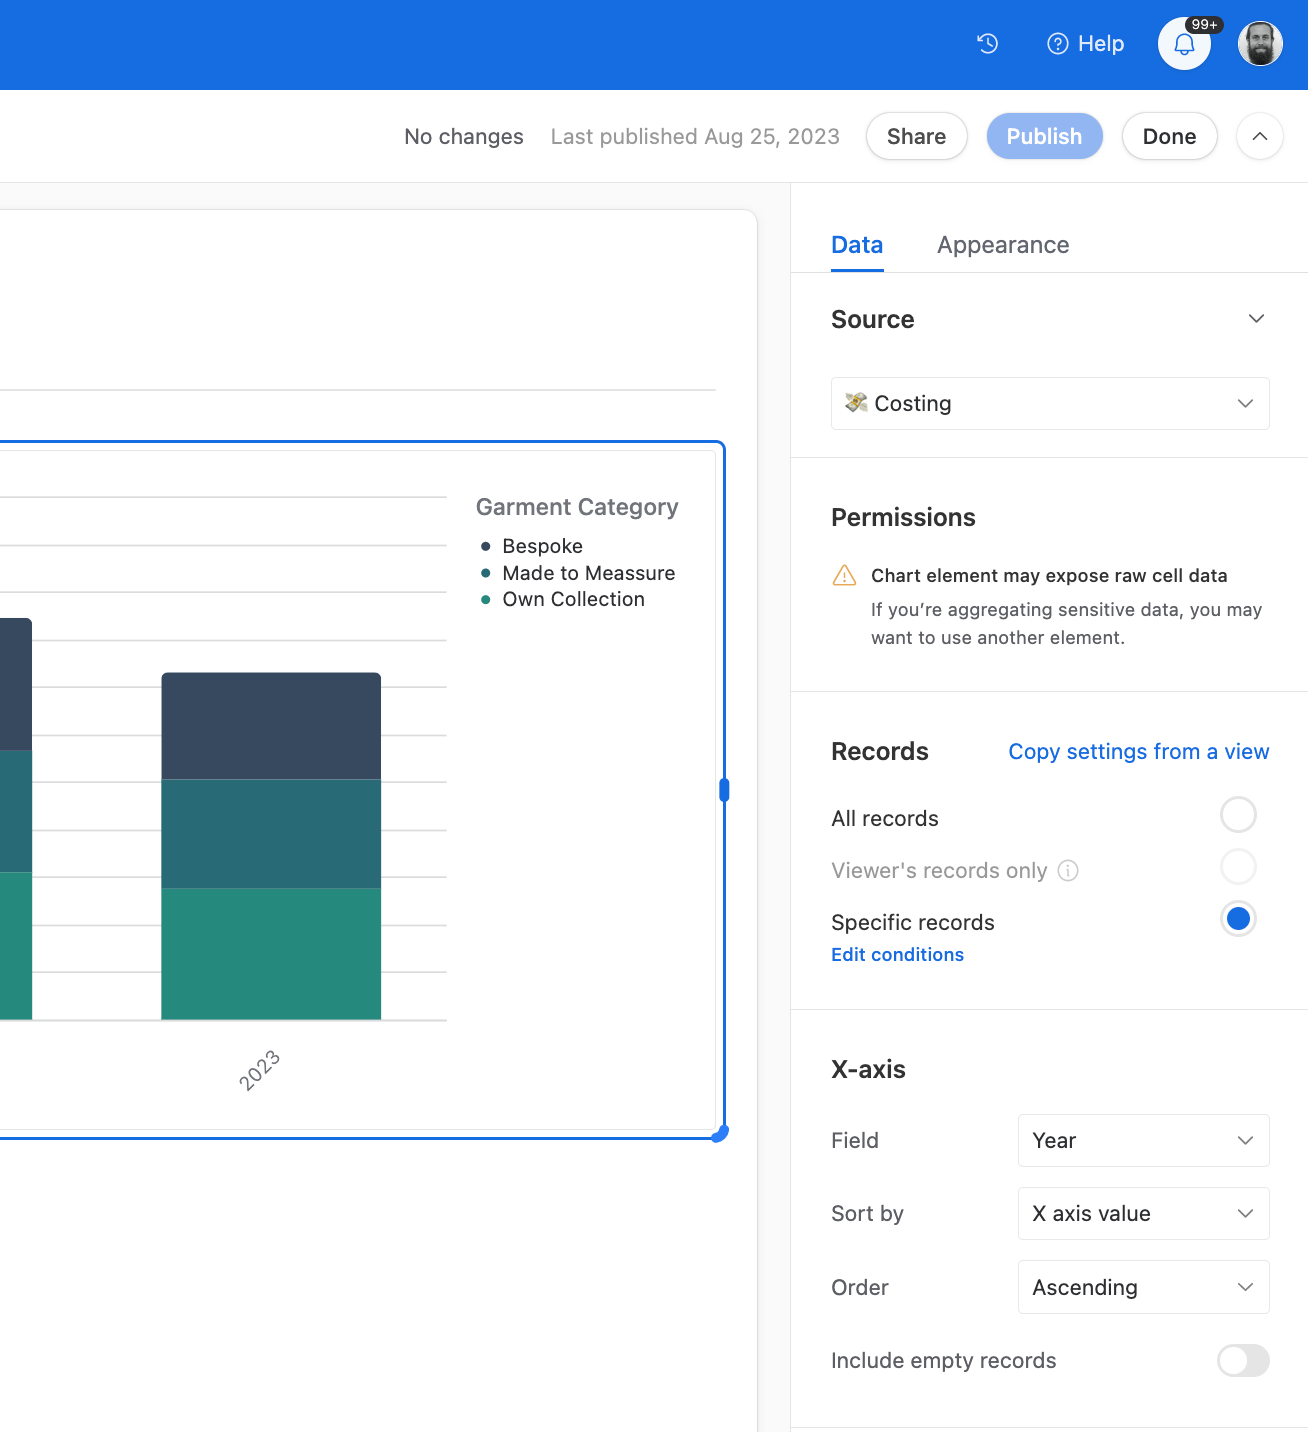
In the interface designer I want a bar chart that summarises all this data.
The X-axis should be the years, then the Y-axis should be the amount of time spent.
Each bar should be a total of time spend in that year. Then each bar should further be divide into the rollup categories.
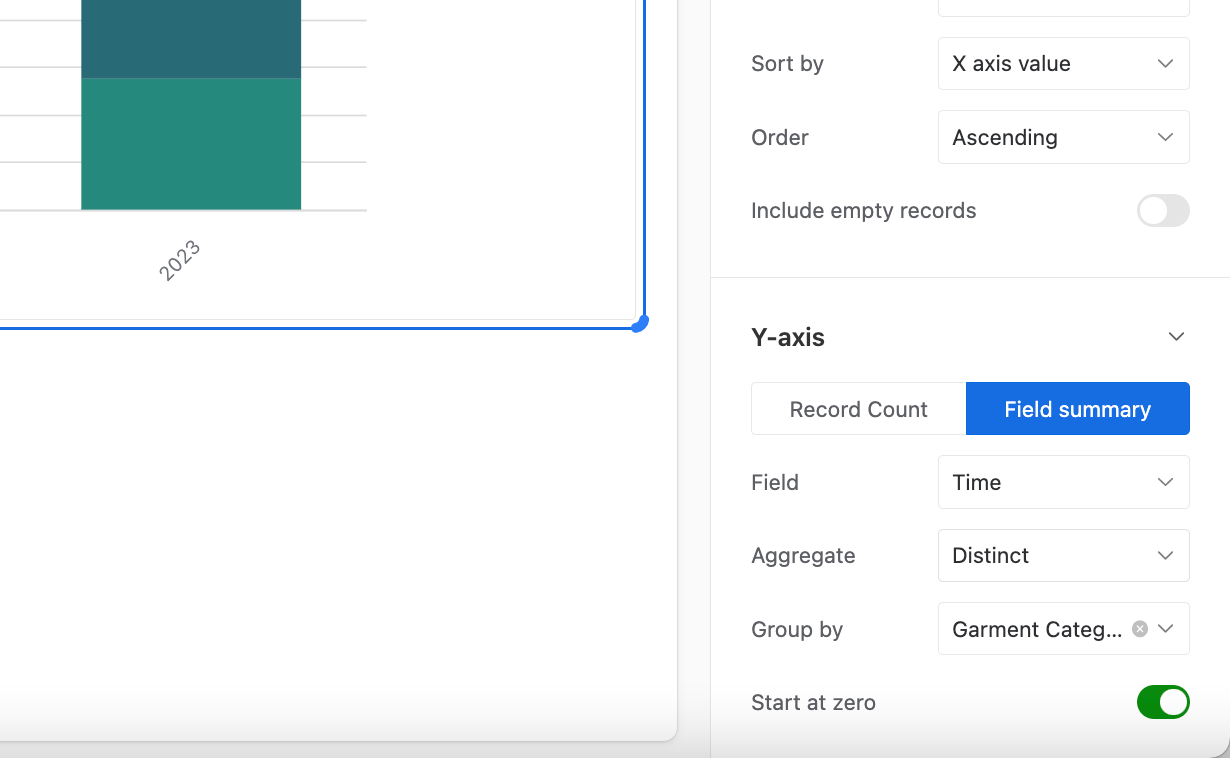
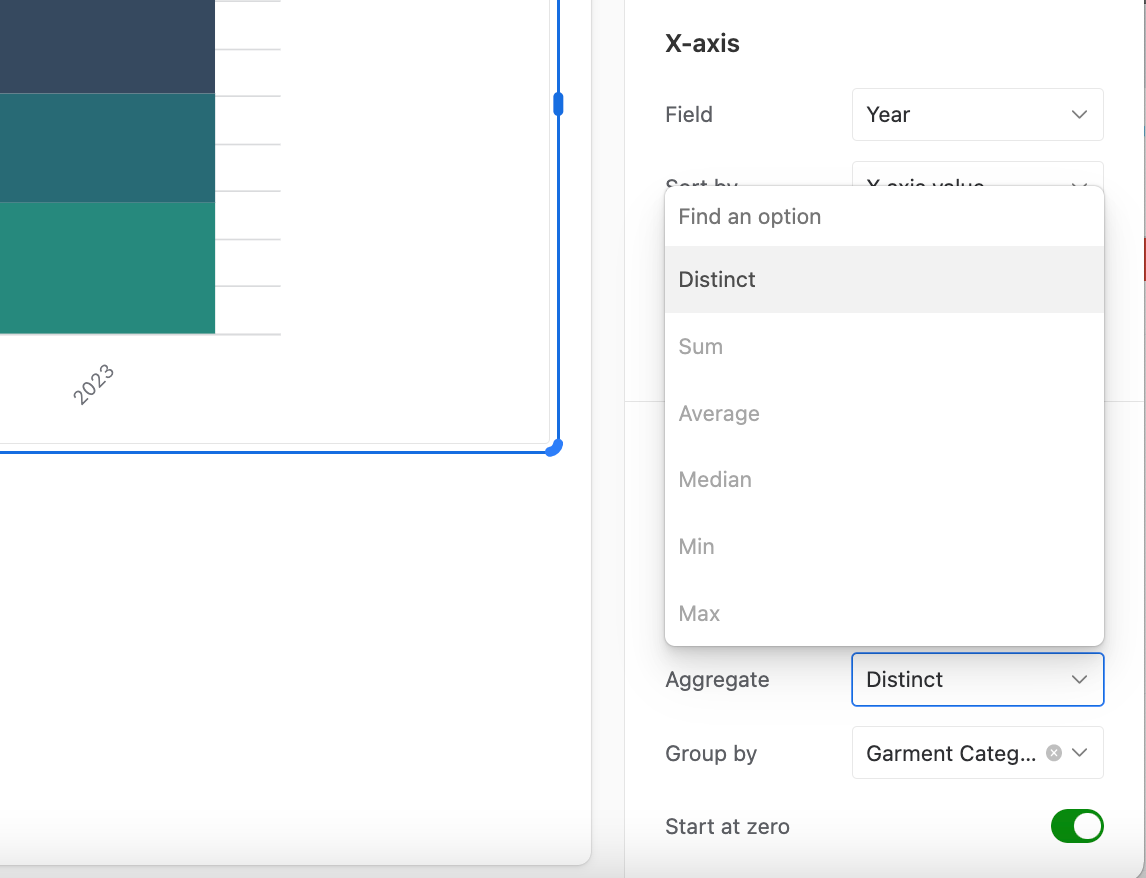
However when I try to summarise the inputted times, every option except from distinct is greyed out - why can I not choose fx the Sum or the Average, which I find weird as a Time input surely is just a bunch of numbers, and its not being computed in a formular field?
