Are there plans to add reporting or data analysis functionality to Airtable? Currently it appears the only way to analyze the data is to either use filters or to export to CSV and use a 3rd party tool. Filters work okay for some basic data analysis but don’t work for cross-table reports. And CSV doesn’t work across tables.
My use case is tracking service delivery, light case management. I need to be able to pull regular reports with SQL type logic that pulls together linked tables and applies logic and formulas to them.
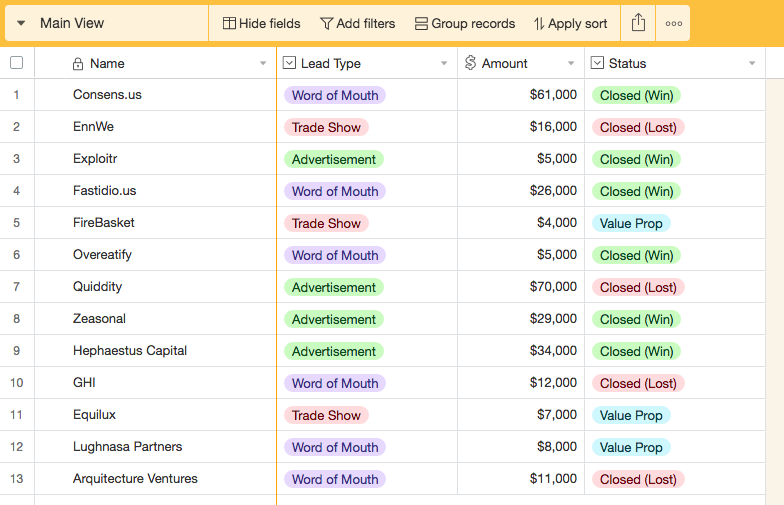
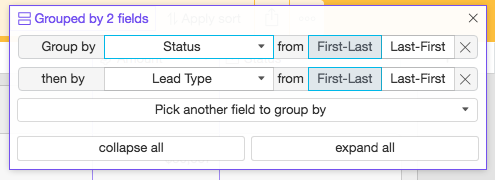
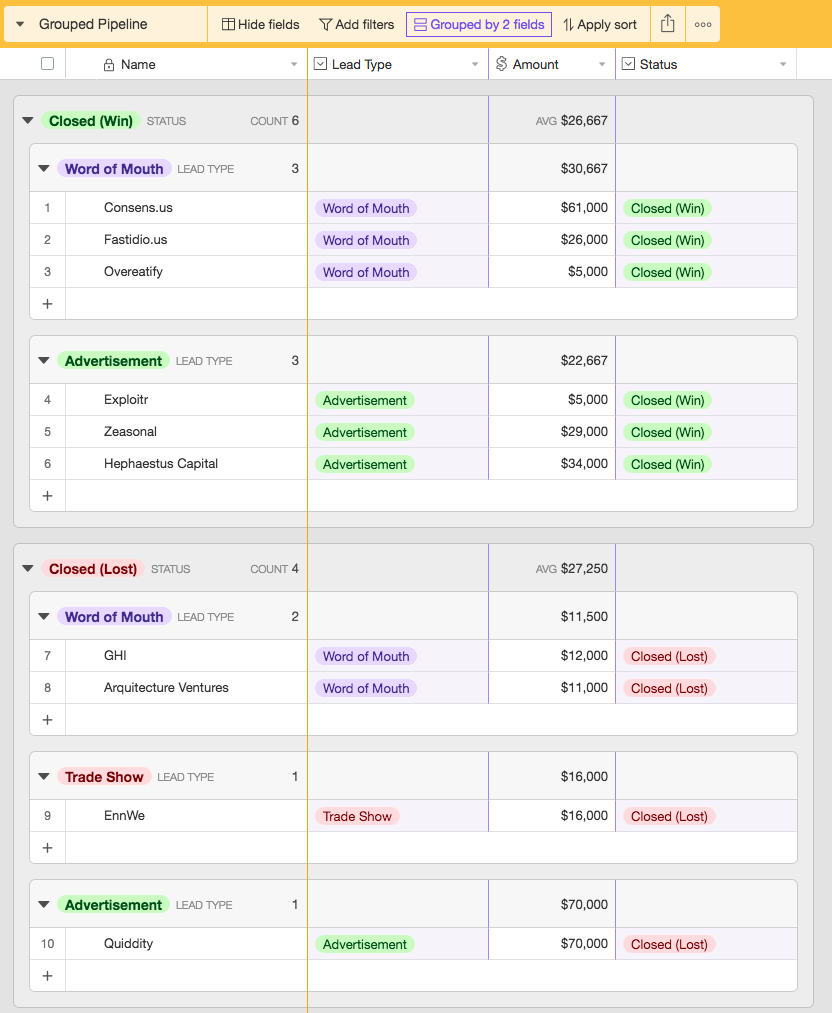
I can get some of this from filters, but I’d like to save the reports so I don’t have to recreate them each time. Saving a different view for each filter would create a massive number of views - not a very good solution. For example, one field is client age. I need to report how many clients fall into 5 different age categories. So in order to save this, I’d need to create a different view for each age category - 5 different views just for that data element.