I want to sync my Airtable View with Google Sheets. Is there any option without using third party tools?


I tried automation but it is creating a new row even when the entry is updated instead of updating the entry in Google Sheets. I extensively use Airtable for my work but Airtable has limitations in data visualization.


For data visualization, I also tried the data studio connector, but unfortunately it is failing frequently.


Any related help is appreciated.


Thanks in advance.

Yes, I have many clients who are doing this on a daily basis, and you can do it all with Make’s Airtable integrations combined with Make’s Google Sheets integrations.

If you’ve never used Make before, I’ve assembled a bunch of Make training resources in this thread. For example, here is one of the ways that you could instantly trigger a Make automation from Airtable

I also give live demonstrations of how to use Make in many of my Airtable podcast appearances. For example, in this video, I show how to work with Airtable arrays in Make.

Hope this helps! If you’d like to hire the best Airtable consultant to help you with anything Airtable-related, please feel free to contact me through my website: Airtable consultant — ScottWorld


That’s because that’s what that automation feature does. It’s not really ideal for many use cases. @Rupert_Hoffschmidt mentions tbelow] a serviced named Coupler.io; perhaps that will serve your needs.


Data Studio, while a nice visualization platform, is not easily utilized with other services and data sources. Power BI (from Microsoft) is similarly brittle in many regards. It’s just a lot of work to get these platforms to play nicely


Indeed, so you want to push data into Google Sheets, render visualizations, and then pull them back into Airtable to display them? Or, do you just want to see them in Sheets?


One approach - don’t send your data (or your users) anywhere and instead build charts instantly and host them in attachment fields in near-real time as image objects. You were quick to rule out third-party services, so I was reluctant to offer this approach. But, Google Sheets is a third-party service, so there’s that. :winking_face:


This approach works well if …


  1. You have some Airtable scripting skills (or can hire with a small budget).

  2. You don’t mind using a free (or near-free) third-party service that does nothing more except build the charts as an image.

  3. Your charts don’t need any dynamic features or drill downs to other charts.


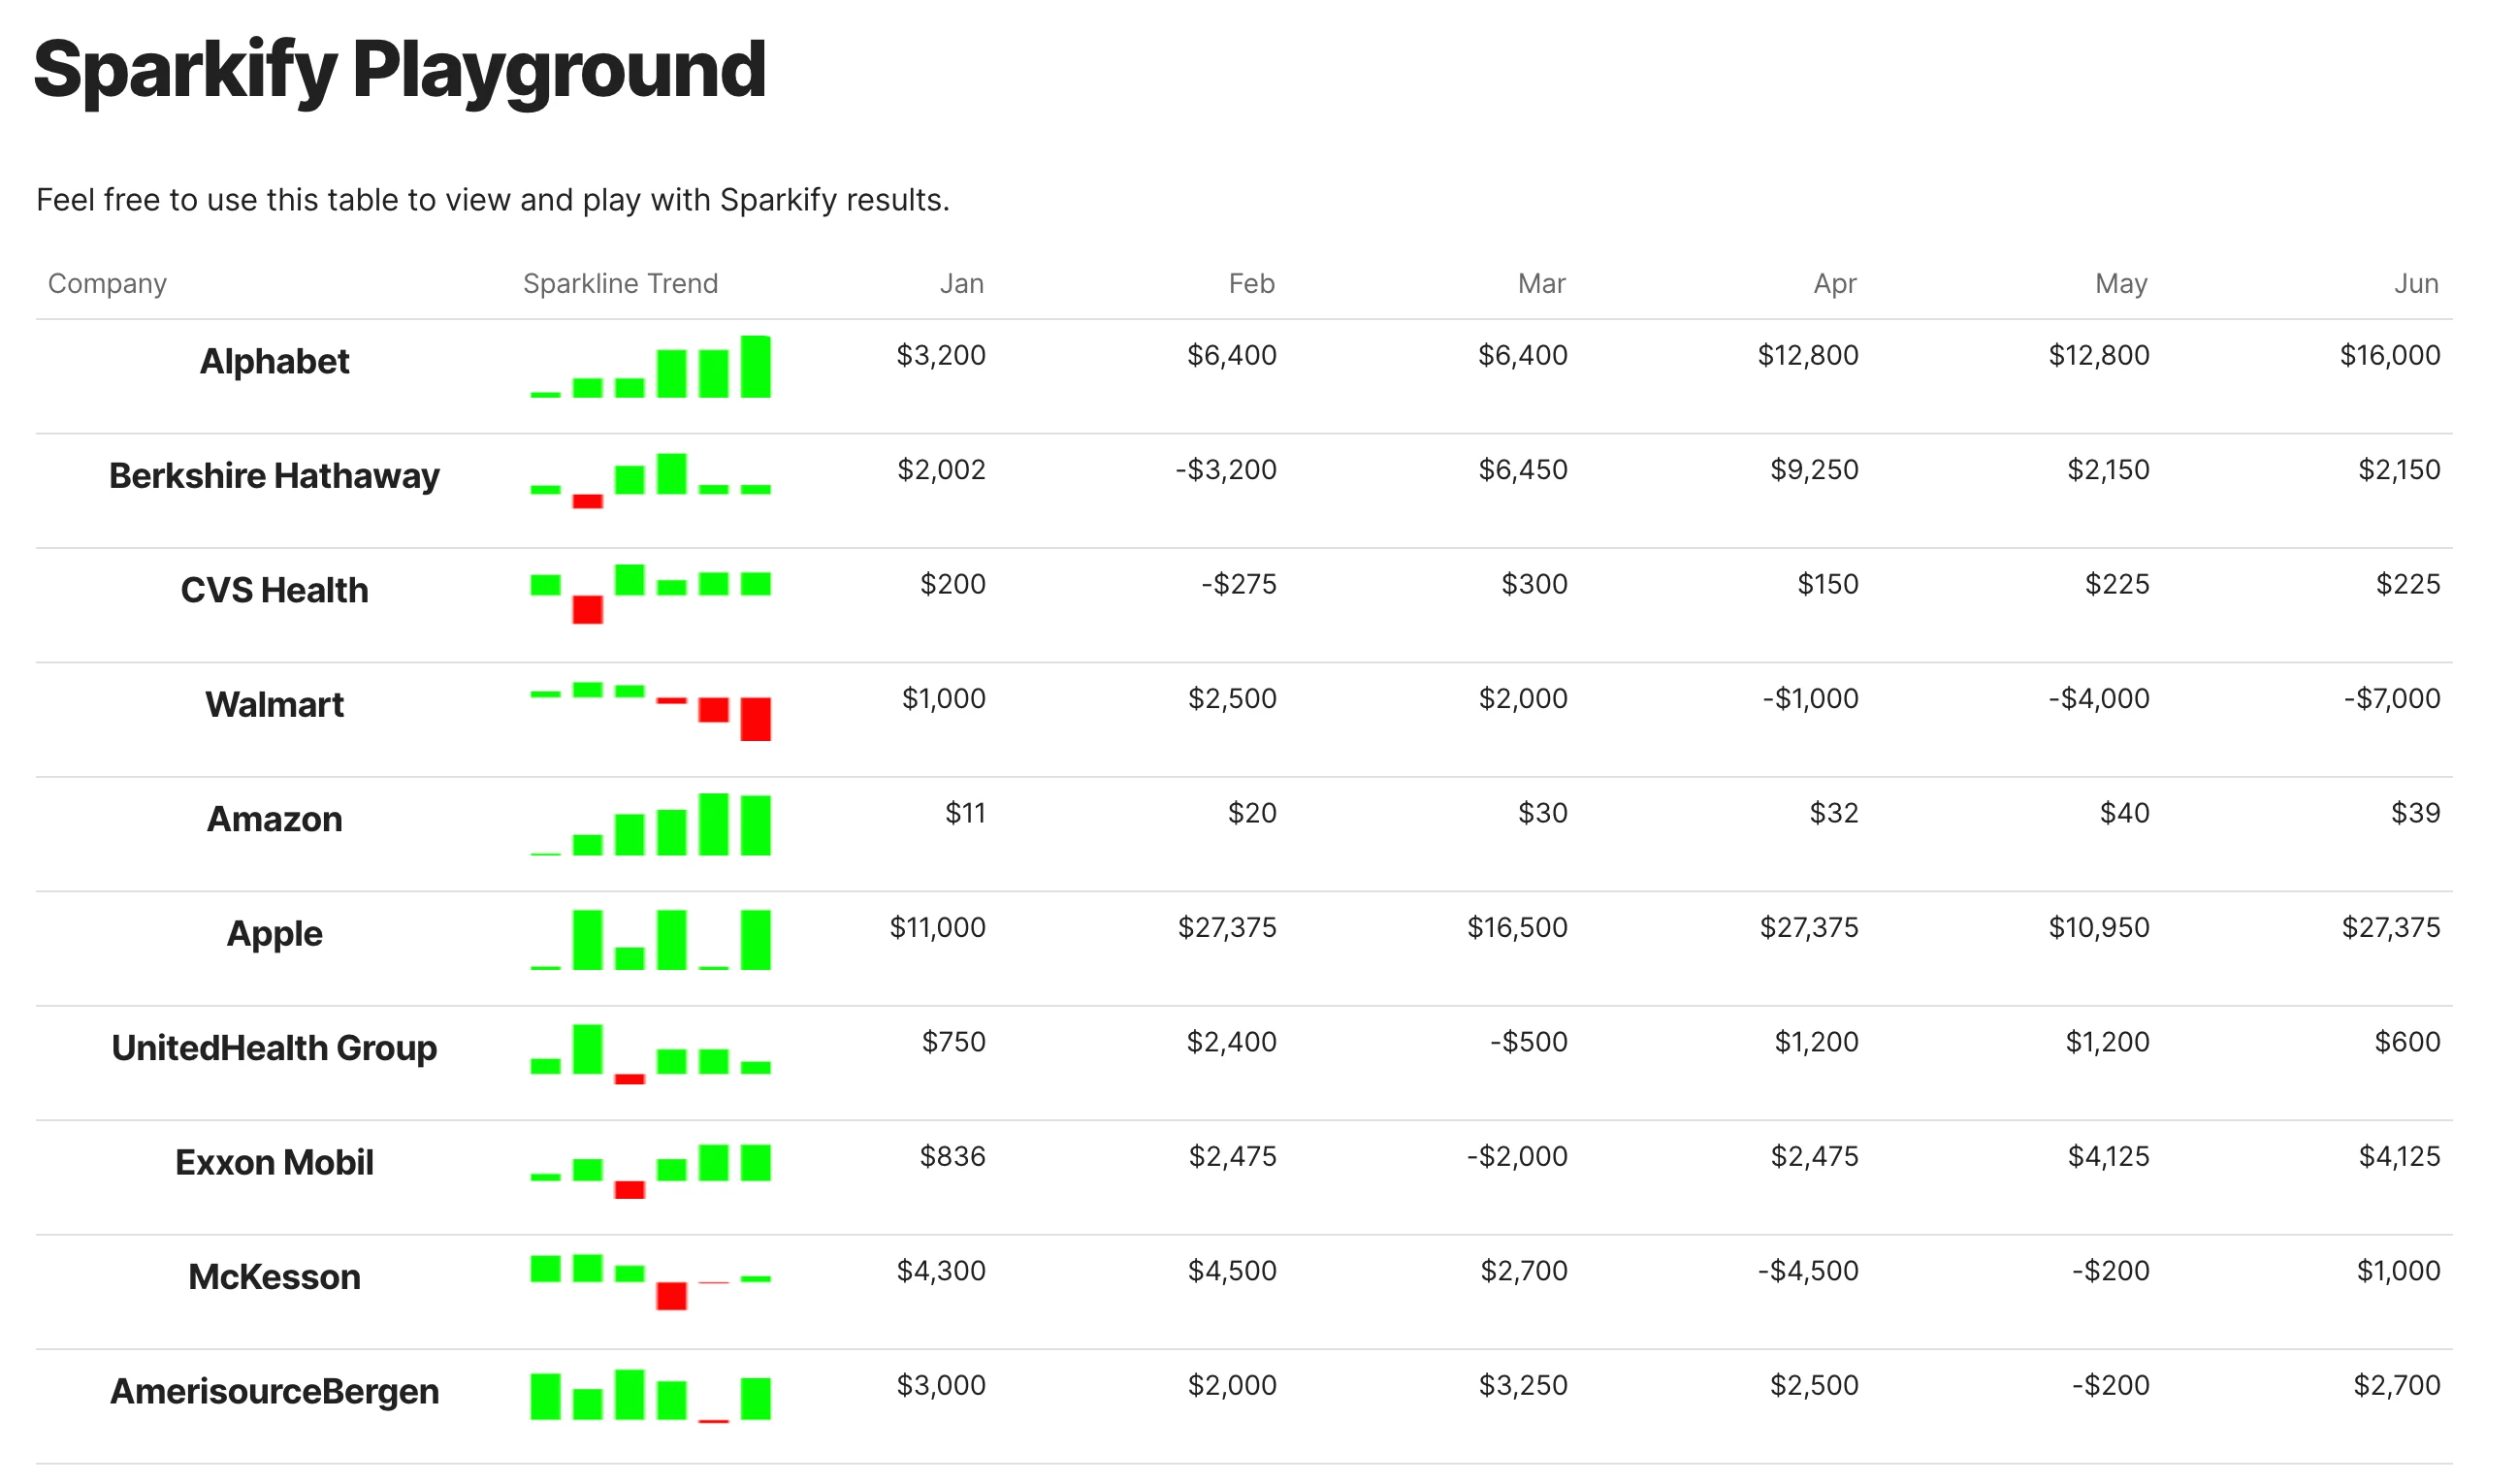
This example shows sparklines, little charts embedded as images but created from the data columns.


And while this example is a Coda application, it is possible to use this same service in Airtable by calling it through a script block or a script automation. Think of it as an HTTP function that returns a chart image almost instantly.


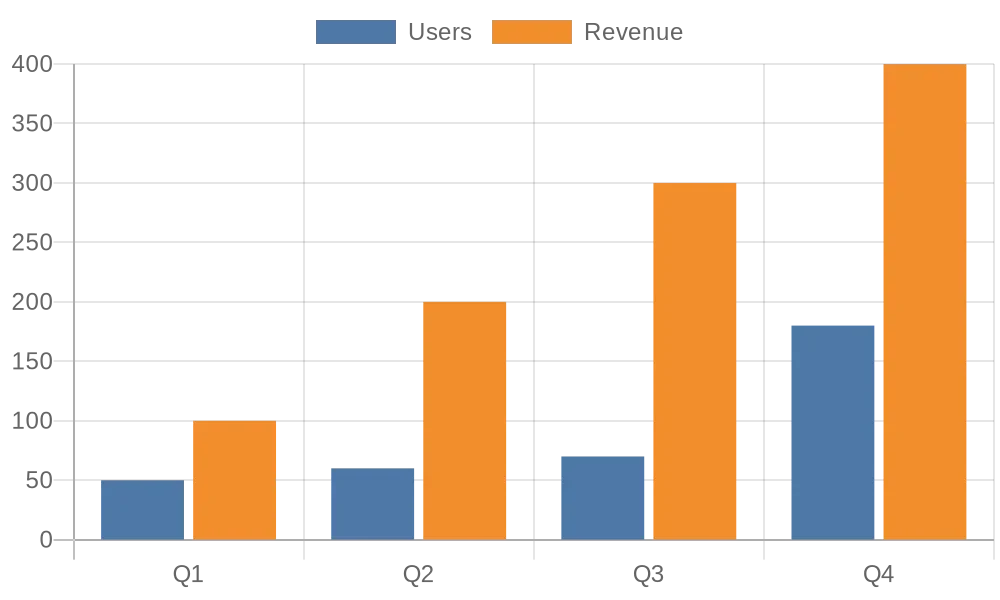
The service is QuickChart.io, and there’s a free tier. To implement this in Airtable you need a script that reads the data values you want to visualize from Airtable tables, fabricates a URL, and calls that URL. It will return an image which means, that chart image can also be added as an attachment and uploaded into an attachment field and/or simply referenced as a link. For example, this URL will return this chart.


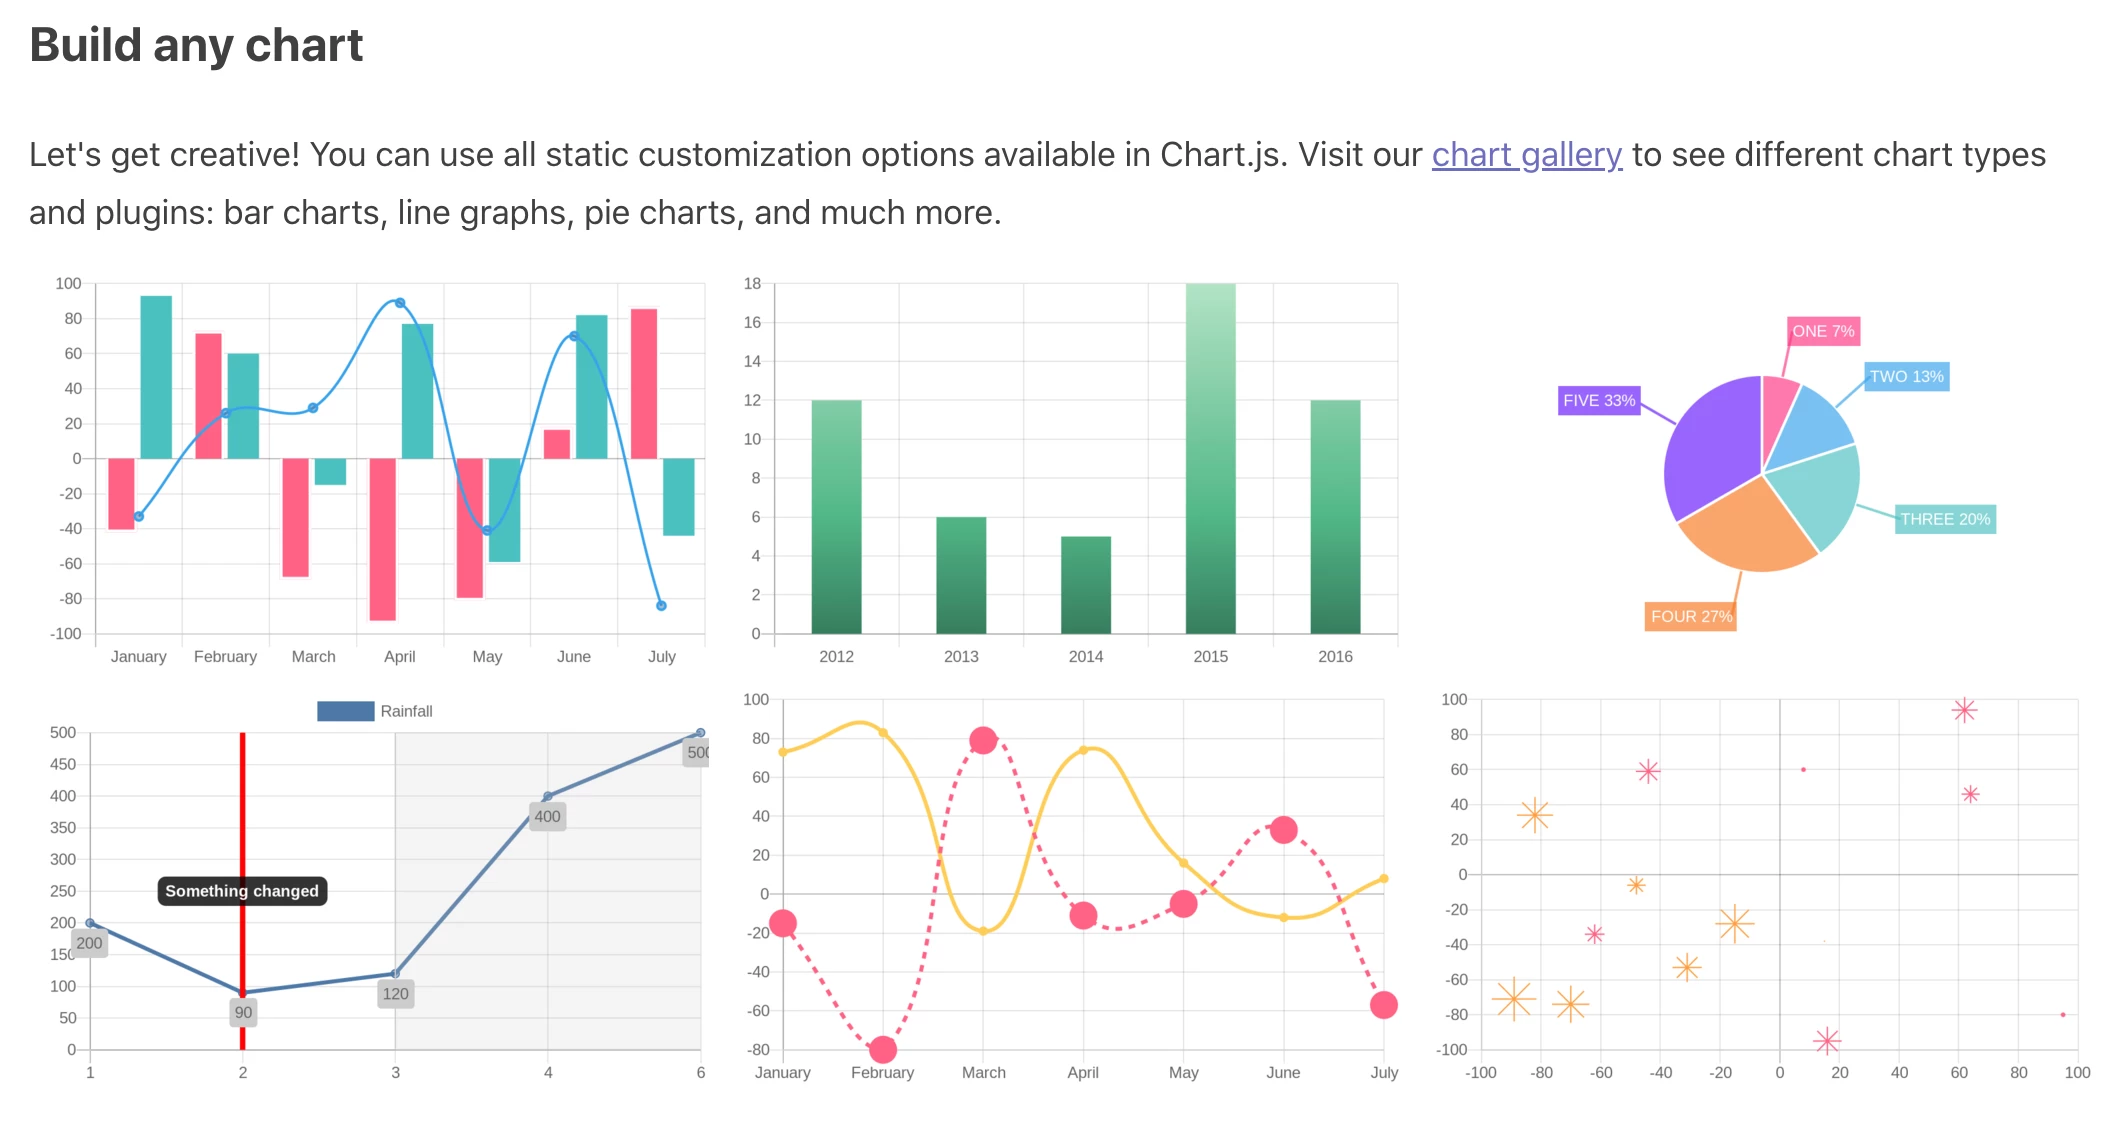
In my view, this is the most elegant way to transform Airtable data into custom charts that are viewable in Airtable. And this service supports many features so you’re not limited to a few basic charts - it is really a wrapper service around the open-source Charts.js library making it possible to create some very complex visualizations.


I’ve used Coupler.io in the past for exactly this purpose and it deep-syncs your table to a Google Sheet. Worked really well for me, but is a bit pricy


That’s because that’s what that automation feature does. It’s not really ideal for many use cases. @Rupert_Hoffschmidt mentions tbelow] a serviced named Coupler.io; perhaps that will serve your needs.


Data Studio, while a nice visualization platform, is not easily utilized with other services and data sources. Power BI (from Microsoft) is similarly brittle in many regards. It’s just a lot of work to get these platforms to play nicely


Indeed, so you want to push data into Google Sheets, render visualizations, and then pull them back into Airtable to display them? Or, do you just want to see them in Sheets?


One approach - don’t send your data (or your users) anywhere and instead build charts instantly and host them in attachment fields in near-real time as image objects. You were quick to rule out third-party services, so I was reluctant to offer this approach. But, Google Sheets is a third-party service, so there’s that. :winking_face:


This approach works well if …


  1. You have some Airtable scripting skills (or can hire with a small budget).

  2. You don’t mind using a free (or near-free) third-party service that does nothing more except build the charts as an image.

  3. Your charts don’t need any dynamic features or drill downs to other charts.


This example shows sparklines, little charts embedded as images but created from the data columns.


And while this example is a Coda application, it is possible to use this same service in Airtable by calling it through a script block or a script automation. Think of it as an HTTP function that returns a chart image almost instantly.


The service is QuickChart.io, and there’s a free tier. To implement this in Airtable you need a script that reads the data values you want to visualize from Airtable tables, fabricates a URL, and calls that URL. It will return an image which means, that chart image can also be added as an attachment and uploaded into an attachment field and/or simply referenced as a link. For example, this URL will return this chart.


In my view, this is the most elegant way to transform Airtable data into custom charts that are viewable in Airtable. And this service supports many features so you’re not limited to a few basic charts - it is really a wrapper service around the open-source Charts.js library making it possible to create some very complex visualizations.


Thank you @Bill.French. You have explained it really well. There are many new things which I learned from your reply.


BTW, I was trying to create a database on Airtable which would be updated regularly and graphs too should update along with it. But no worries I am trying to explore more about Sparkify, Quickchart and Chart.js from the URLs you have shared because some of them seems to be more satisfying to me.


Again, thank you.


If you are looking for a completely automated way to extract the data from Airtable to Google Sheets, I would recommend considering Coupler.io. It is a no-code data integration software, with the help of which you can fetch the data from Airtable on a desired schedule to one of the following destinations like:

  • Excel;
  • Google Sheets;
  • BigQuery;

To have a better understanding, please use Airtable Source link to learn more about this integration. Also you can take a look at step-by-step guide of how to extract the data from Airtable to Google Sheets with the help of Coupler.io


CSV Getter is a good way of doing exactly this. It is a paid tool and I am affiliated, but the guide shows you how it works before any commitment.

You can try it for free also:


Export Airtable to Google Sheets


Reply