Hi all,
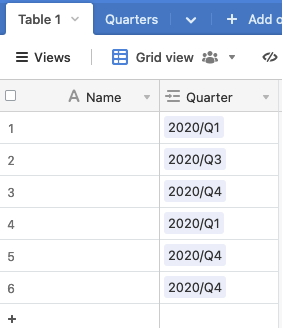
Sorry for the long-winded explanation but I’m hoping to get my head around the best way to use the chart extension to show project starts for each Quarter. In short, we have a base where each record is a project, and one column nominates a yearly quarter each project to start (ie. “Q1/2021” for projects starting in the first quarter of 2021).
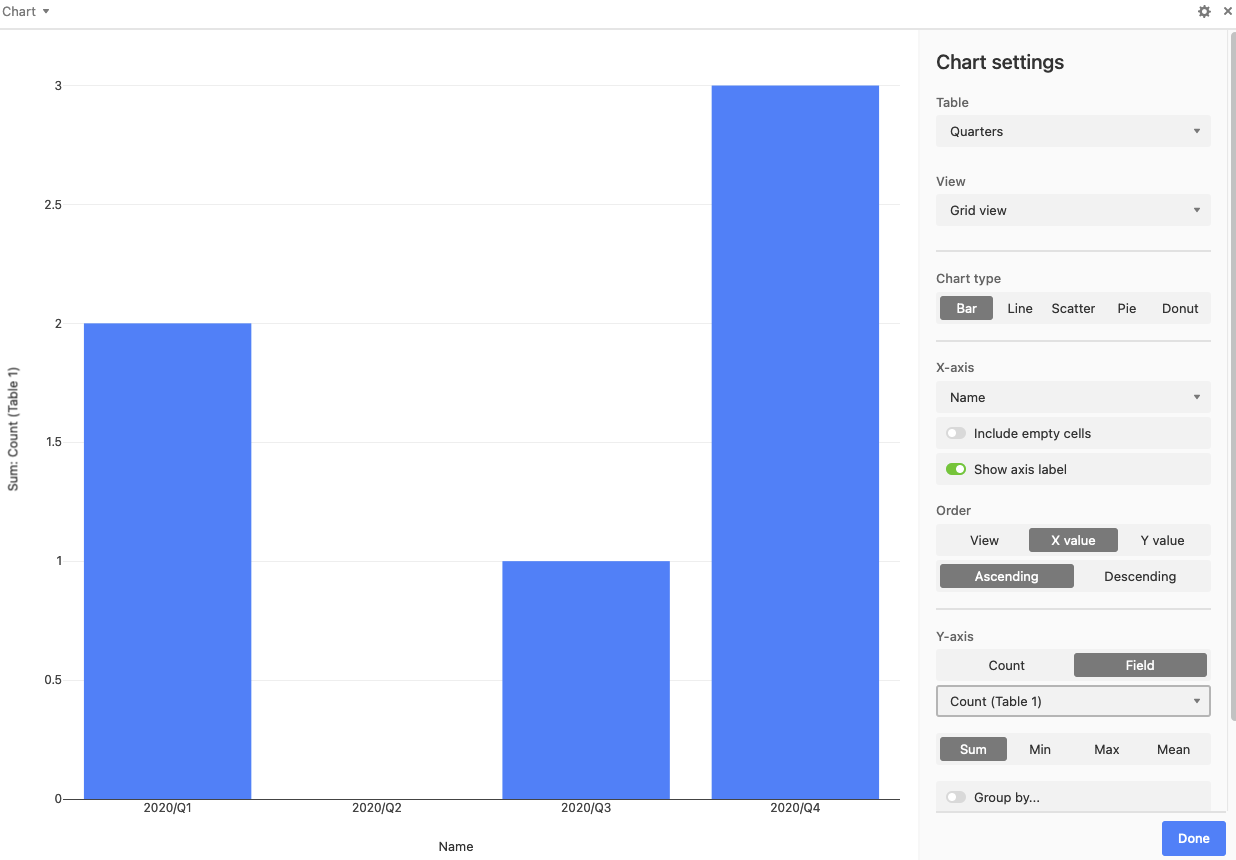
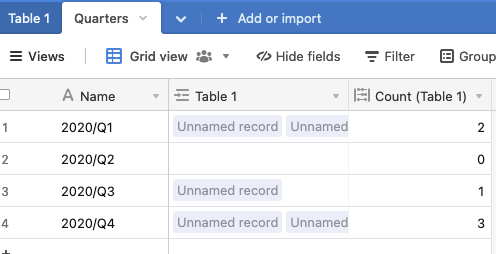
Problem when charting is (1) I can’t seem to arrange the x-axis in the correct sequence, and (2) it doesn’t seem to allow for quarters with no projects starting.
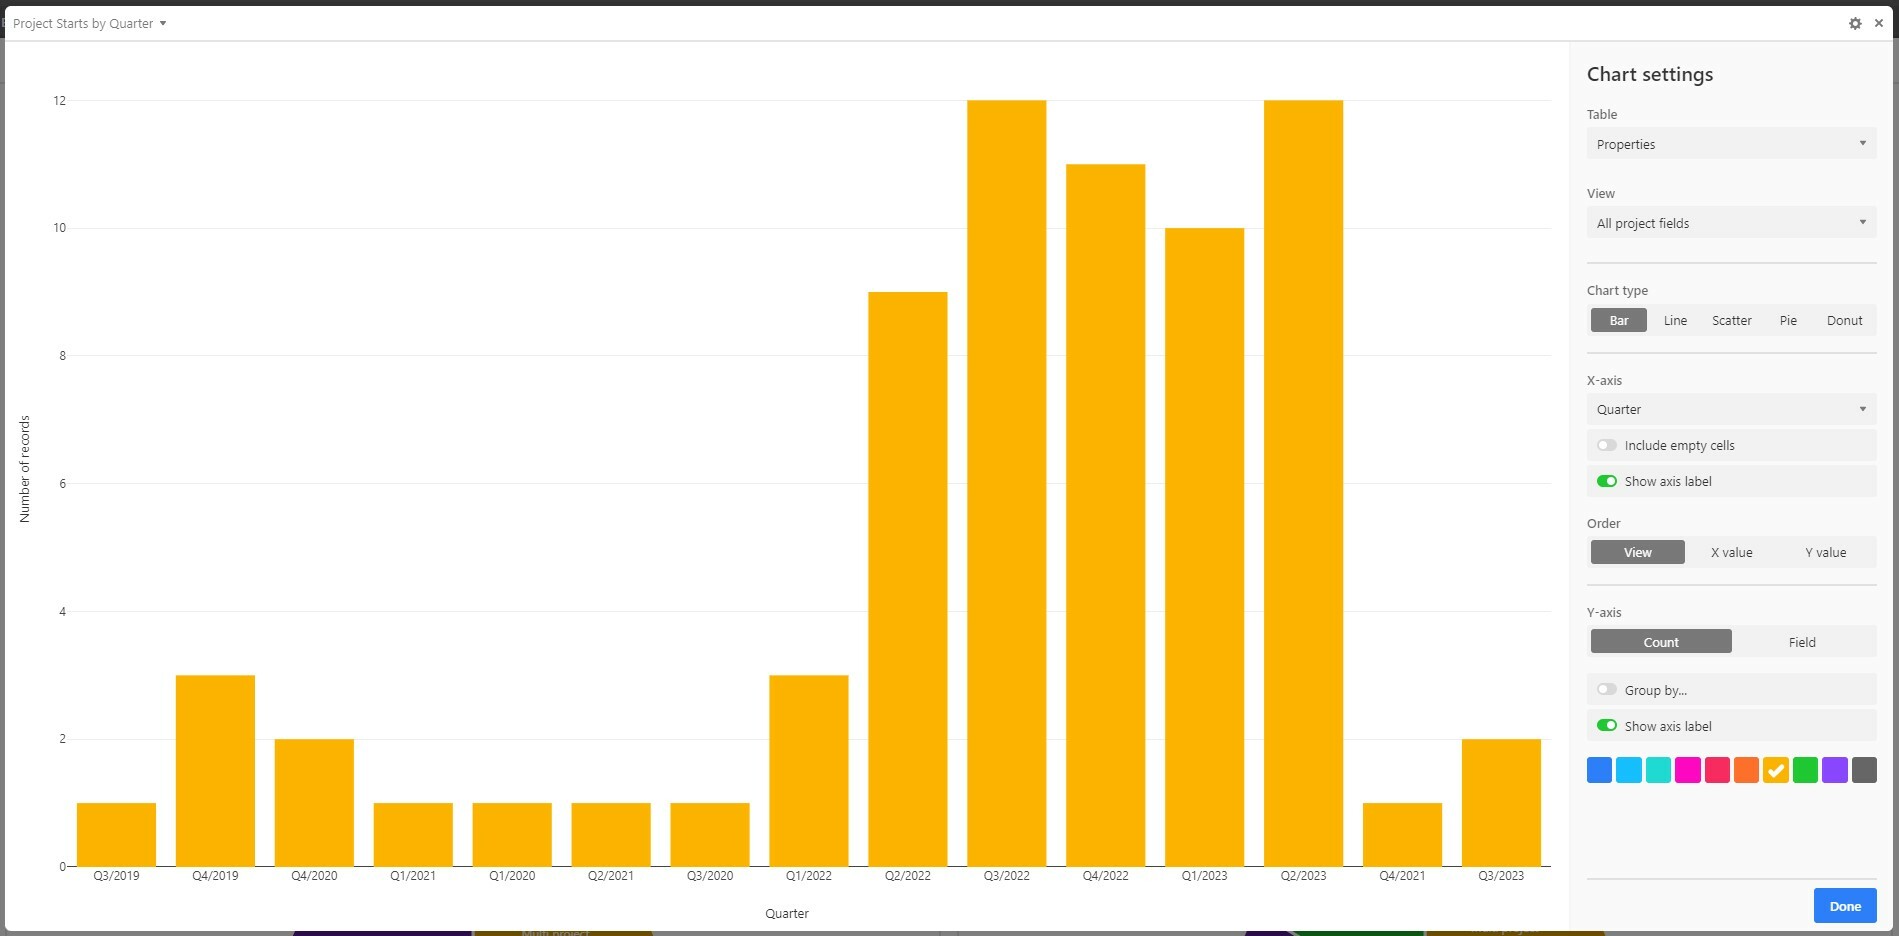
If I sort by ‘view’, it appears to arrange the x-axis by the order in which they appear on the grid:
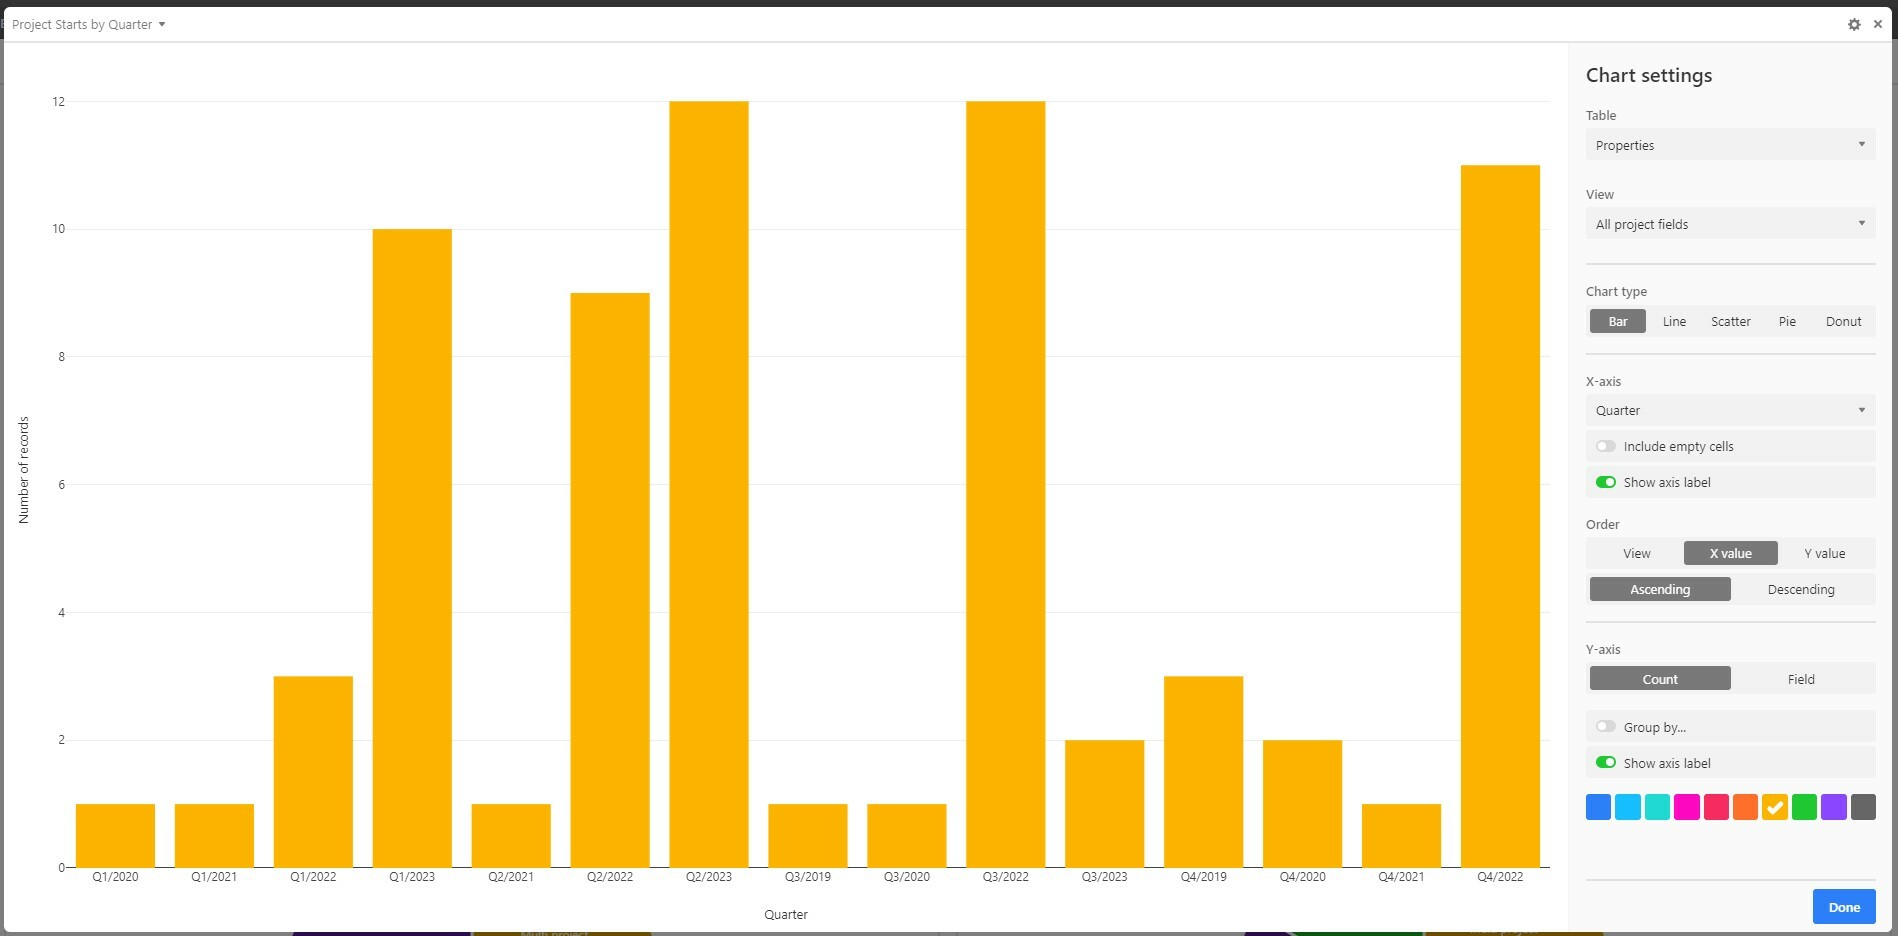
If I arrange by “X value”, it sorts all Q1 together, then all Q2 together:
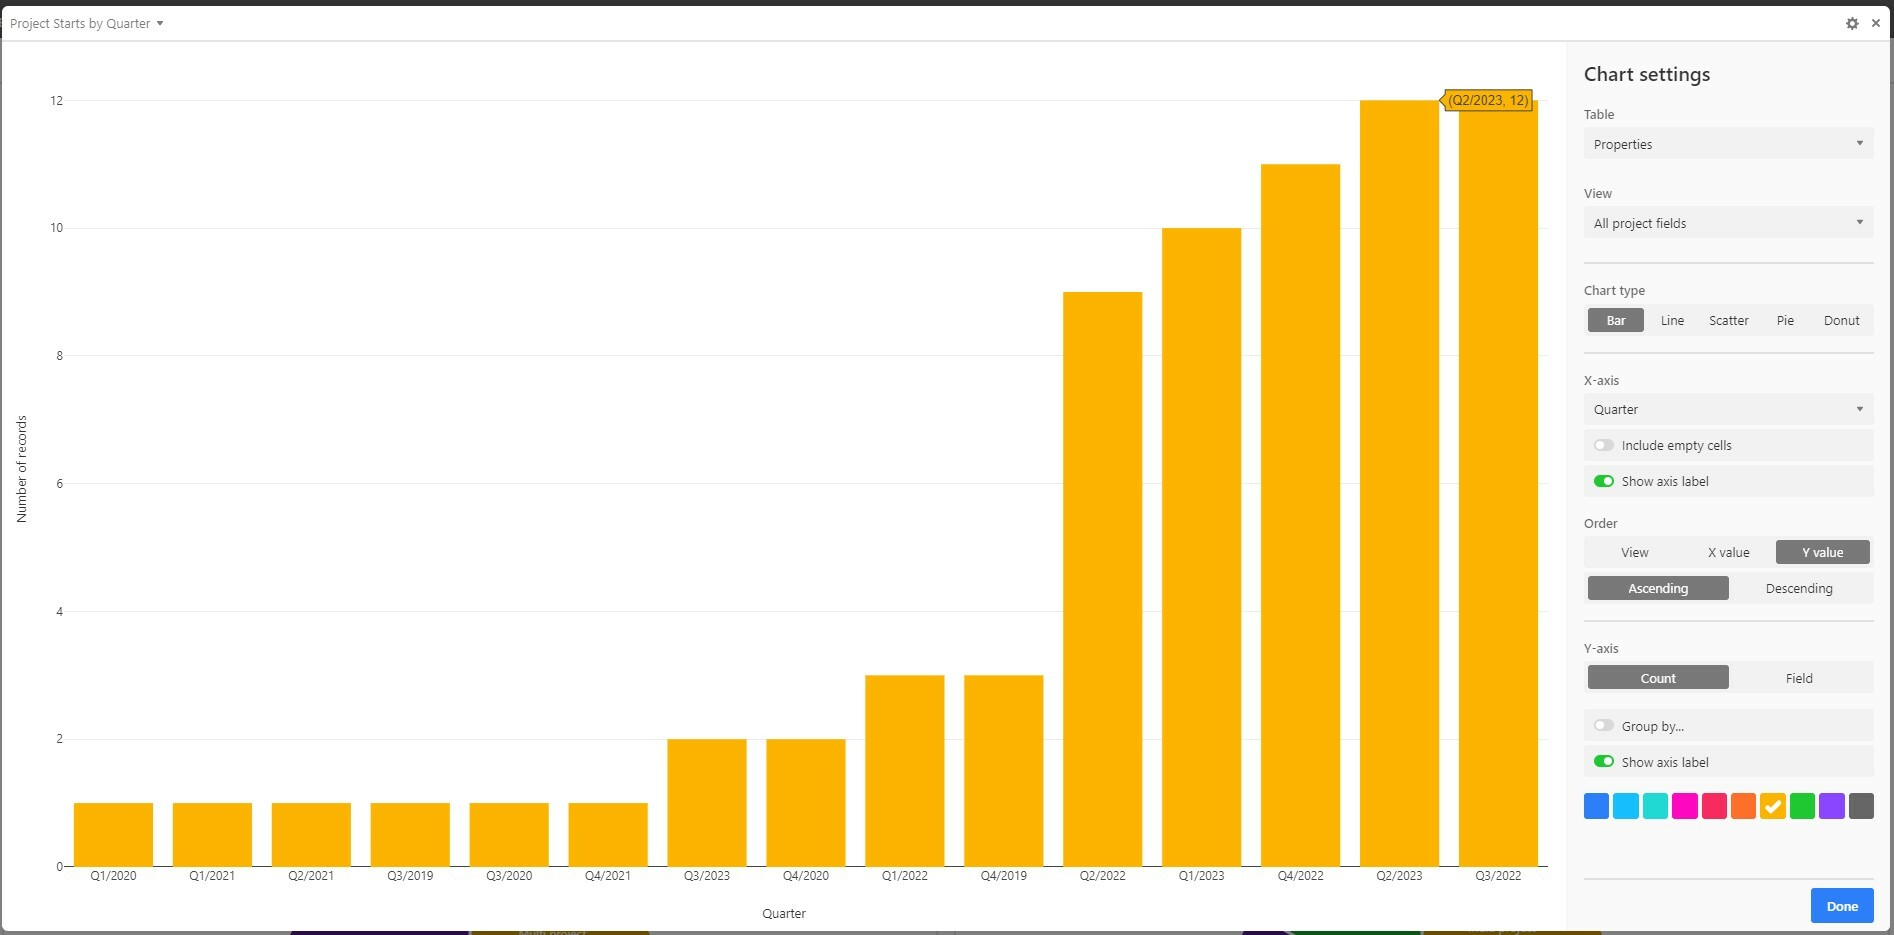
If I arrange by “Y value” it sorts by total count for each quarter:
If anyone knows the best way to arrange the data so the X axis is in the right order AND allows for quarters with zero starts, that would be great! Do I need a separate view set up with only that data in the correct order, or can I use the existing view?
Thanks in advance!
AC