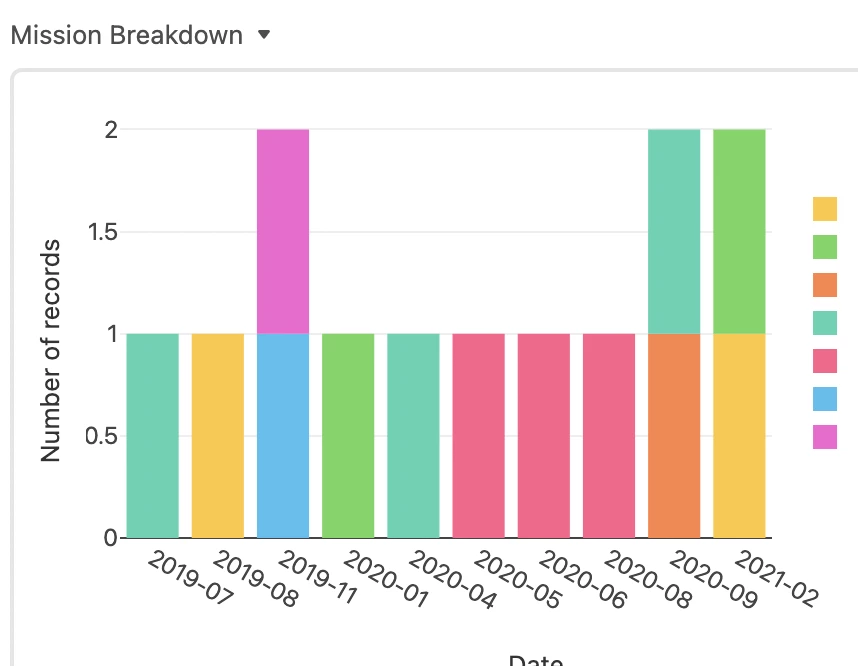
I’m using a chart block to track number/type of events over time. Some months we’ll have 2, some months we’ll have none. In the current chart block, months with no data do not appear, making it impossible to tell the overall timeline at a glance without reading the x axis. Is there a workaround I’m not seeing here – a way to see the “empty” months?